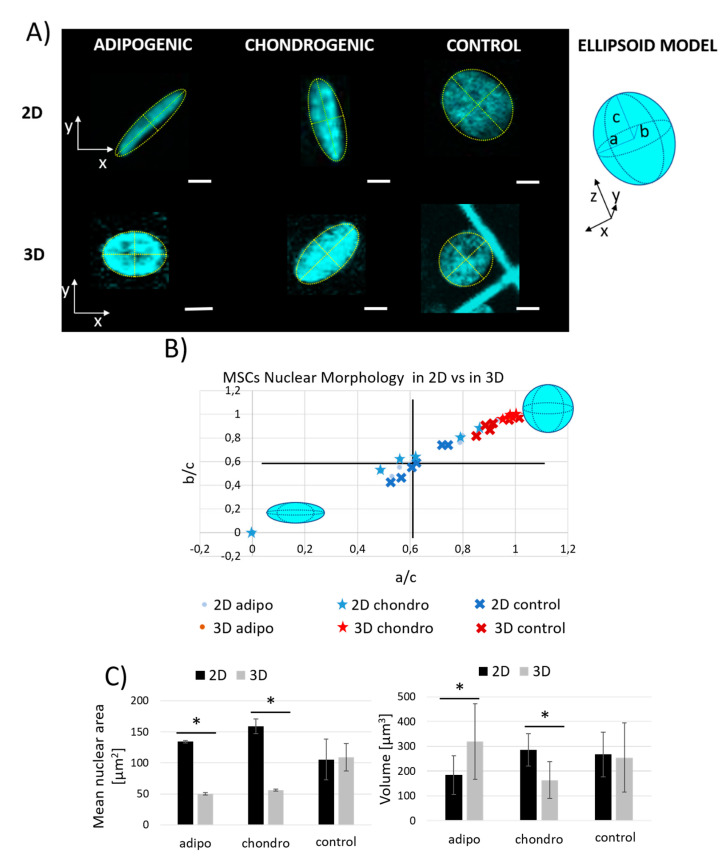
Figure 2.
MSCs nuclear morphology assessment inside Nichoids (3D) and on controls (2D) after 21 days of culture with adipogenic, chondrogenic, and basal media. (A) Fluorescence images of single cell nuclei stained with Hoechst 33342 obtained by confocal fluorescence microscopy in the different culture conditions and schematic representation of the ellipsoid model of the MSCs nucleus with evidenced semi-axes: a, major, b, minor and c, vertical. Scale bars 5 μm. (B) Scatter plot representing the nuclei of differentiated and control cells on 3D Nichoids and on flat glass substrates, in order to compare their nuclear morphologies by means of the relationship on the ratio between the minor (b) axis with respect to the vertical (c) semi-axis and the ratio between the major (a) with respect to the vertical (c) semi-axis, respectively. These calculations allowed to investigate the effect of the Nichoid on the nuclear shape in terms of nuclear flatness and elongation. All the parameters considered were measured by Fiji-ImageJ Measure tool for ellipsoid fit, as described in Materials and Methods. (C) On the left: quantification of the mean nuclear area of nuclei measured using the maximum projection of all the acquired nuclear planes; on the right, mean nuclear volume, calculated as described in Materials and Methods. * p < 0.05.

