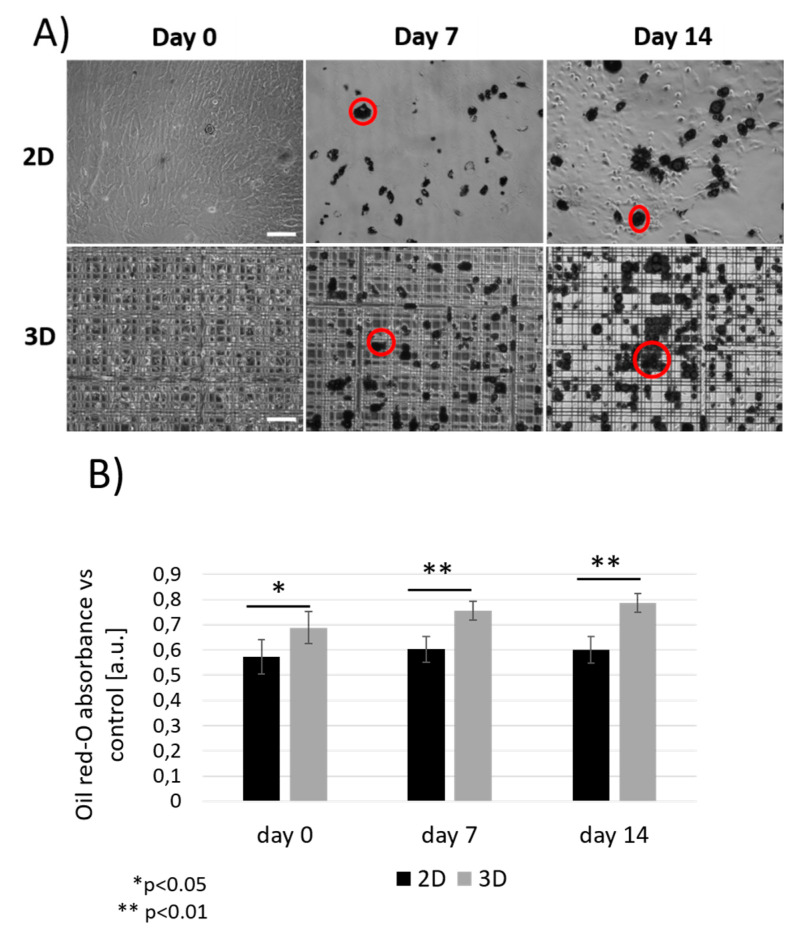
Figure 3.
Oil red-O staining of MSCs cultured with adipogenic differentiation media both inside Nichoids (3D) and on glass substrates (2D). (A) Brightfield images of differentiated cells taken after 24 h, 7 and 14 days from the beginning of the experiment, in which lipids appeared in dense dark aggregates. Examples of lipid vesicles are highlighted by red circles. Scale bar 100 μm. (B) Oil red-O absorbance measured at 490 nm at each time point for both 2D and 3D culture configurations. Data were normalized with respect to values from pure oil red-O and undifferentiated controls. ** p < 0.01, * p < 0.05 from pair wise comparison.

