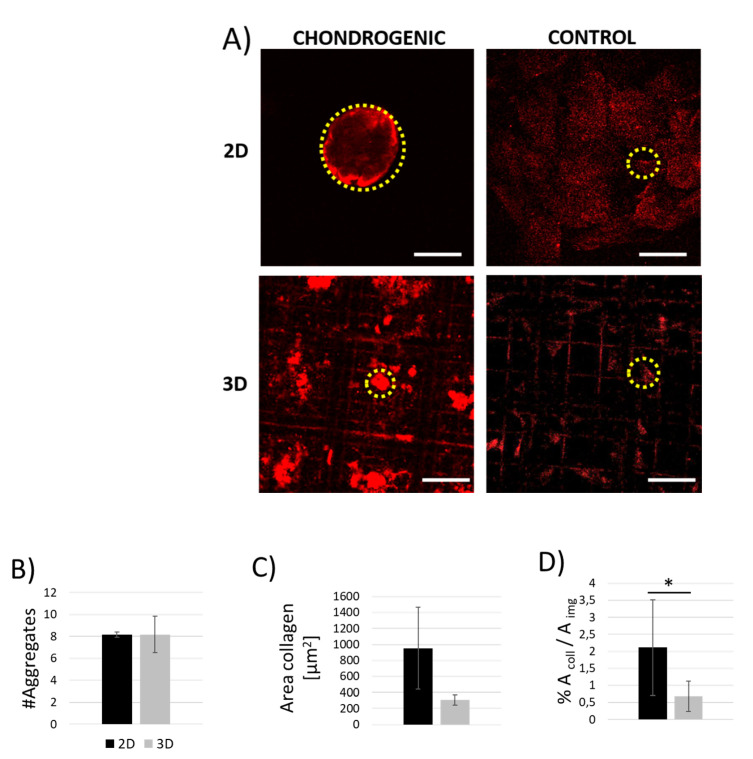
Figure 7.
Indirect collagen measurements of MSCs exposed to chondrogenic and basal media at 21 days from the seeding. (A) Immunofluorescence images showing in red the signal corresponding to collagen type-I stained with anti-collagen I conjugated to Alexa Fluor 647. Examples of collagen bundles synthetized by MSCs both on glass substrates (2D) and on Nichoid scaffolds (3D), are indicated by yellow circles. Scale bars 50 μm. (B–D) Collagen-I analysis allowed to quantify the number (B) and the average area of collagen aggregates (C), and the average total area of collagen produced in each of the cases considered with respect to the area of the image (D). * p < 0.05.

