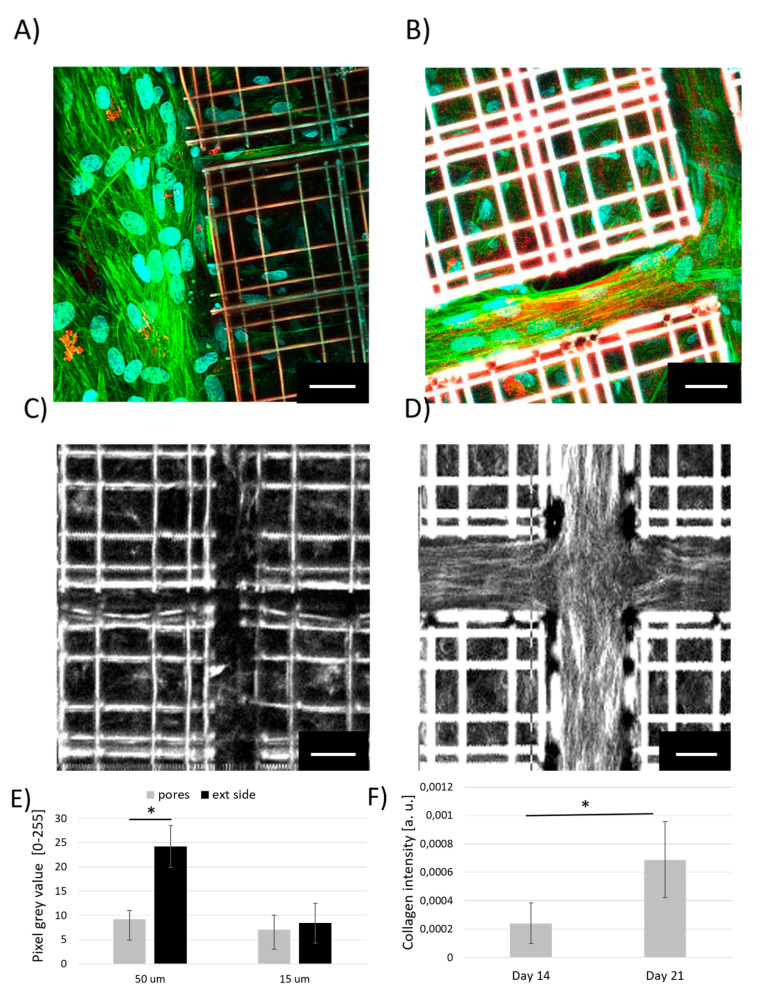
Figure 8.
Chondrogenesis of MSCs inside Nichoids. (A,B) Immunofluorescence images, 512 × 512 pixels, of differentiated MSCs inside Nichoids with standard (A) and revised geometries (B): collagen appeared in red, F-actin in green and nuclei in cyan. (C,D) Second harmonic generation (SHG) microscopy of vital and unlabeled cells after three weeks of exposure to differentiation medium inside standard Nichoids (C) and in Nichoids with more distant matrixes (50 μm) (D), 200 × 200 pixels. (E) Collagen-SHG intensity signal measured both inside pores and outside the scaffold in the two Nichoid geometrical configurations. (F) Collagen-SHG intensity signal measured in the new geometrical configuration of the scaffold at day 14 and 21 from the beginning of the differentiation. * p < 0.05. Scale bars 20 μm.

