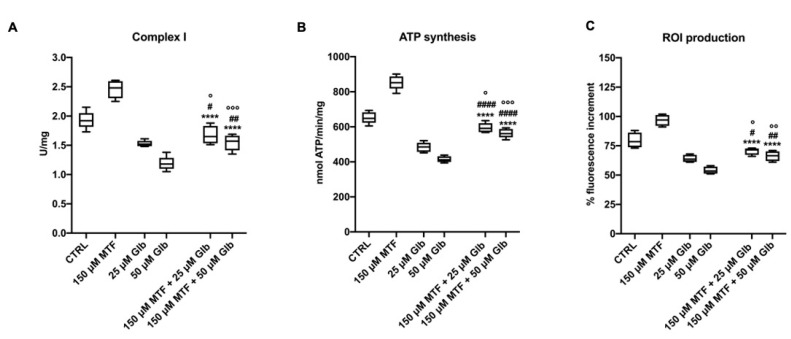
Figure 4.
Effect of combination treatment with low doses of MTF and GLB on the aerobic metabolism and ROI production in rod OS. Figure reports the effect of the combination treatment compared with the single treatment. Treatments were: 150 μM MTF + 25 μM GLB and 150 μM MTF + 50 μM GLB. (A) Complex I activity, expressed as uU/mg of total protein. (B) ATP synthesis trough Fo–F1 ATP synthase expressed as nmol of ATP produced/min/mg of total protein. (C) ROI production in rod OS exposed to the light. Data are from n = 5 independent experiments. **** indicates a significant difference for p < 0.0001 between the combination treatments and 150 μM MTF treatment. #, ## or #### indicate a significant difference for p < 0.05, 0.01 or 0.0001, respectively, between the combination treatment and the respective only GLB treatment. °, °° or °°° indicate a significant difference for p < 0.05, 0.01 or 0.001, respectively, between the combination treatment and the untreated samples.

