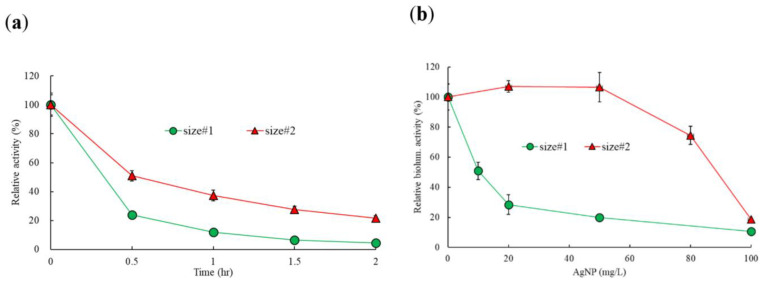
Figure 1.
Response curves of the effects of two different sizes of AgNPs on bioluminescence activities of RB1436: (a) change of the percentage of relative bioluminescence activity during 2 h incubation periods with 50 mg/L AgNPs; (b) comparisons of the relative activity at the exposed dose ranges. Values are the mean ± SD (standard deviation) of triplicate samples.

