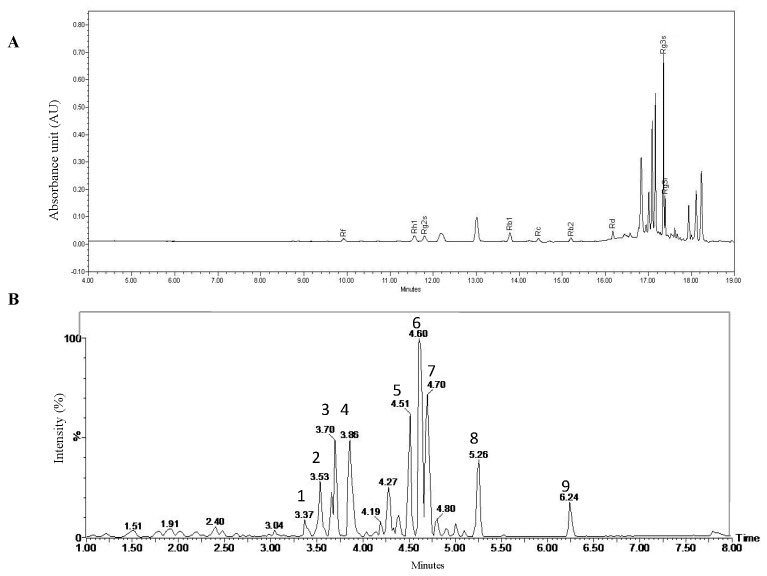
Figure 1.
Bioactive compound analysis in Rg3-RGE and Persicaria tinctoria (PT). Chromatogram for the HPLC analysis of Rg3-RGE (A) with the respective ginsenosides identified as labeled on their respective peaks. UPLC–QTofMS analysis of PT and their identified peaks (B). Constituents of PT are summarized in Table 1.

