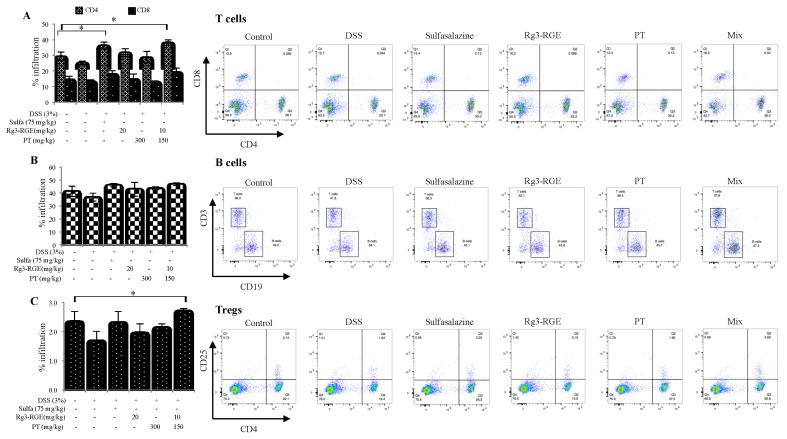
Figure 8.
Effects of Rg3-RGE + PT on immune cell subtypes in the spleen. (A) Percentage of CD4+ and CD8+ cells, (B) CD19+ cells and (C) CD4+CD25+ cells in the spleen. * indicates a significance of p < 0.01 for treatment group when compared to the DSS-treated group. Values in bar graphs represent mean ± SD of four independent experiments. Analysis was conducted on the same day of termination.

