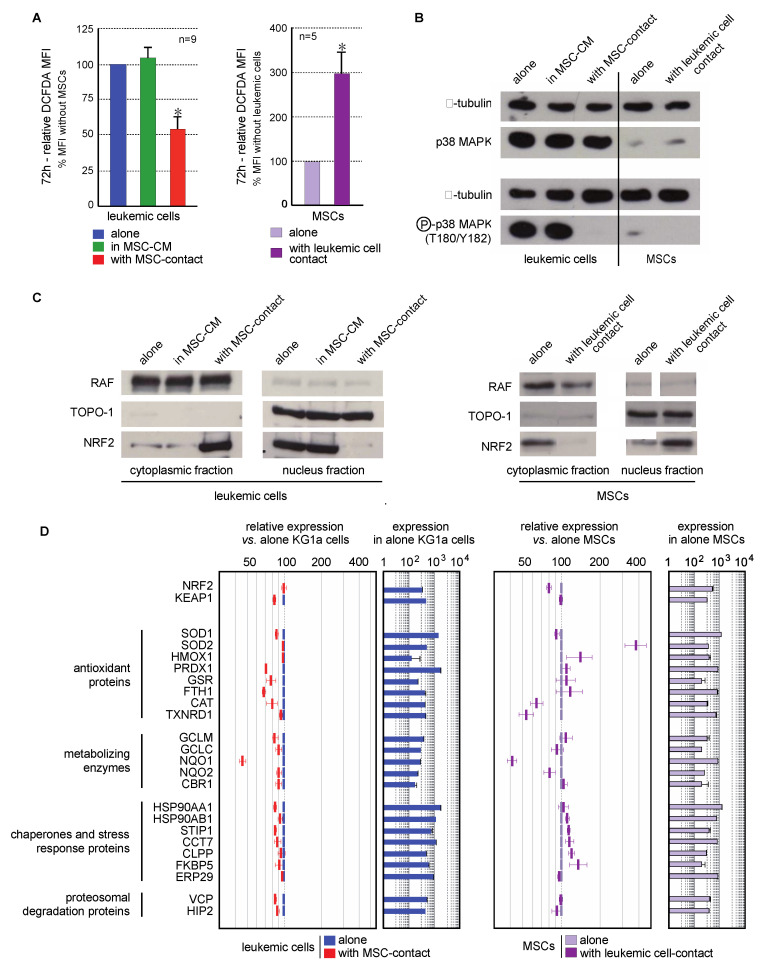
Figure 4.
Interaction between leukemic cells and MSCs induces opposite oxidative metabolism and Nrf2 pathway modifications in both cell types. (A) Intracellular ROS level was analyzed by flow cytometry after CM-H2DCFDA staining in leukemic cells cultured alone (blue), with MSC-CM (green), or with MSCs (red) as well as in MSCs cultured alone (violet) or cocultured with KG1a cells (dark violet) for 72h (n = 5–9). (B) The expression and activation of p38MAPK were analyzed by Western blot in KG1a cultured alone, with MSC-CM or cocultured as well as in MSCs alone or cocultured with leukemic cells (n = 3); alpha-tubulin was used as loading control. (C) Nrf2 subcellular localization was analyzed by Western blot in the cytoplasmic and nuclear fractions of leukemic cells (left) or MSCs (right). RAF and TOPO-1 were used as loading controls and purity indicators of the cytoplasmic and nuclear fractions, respectively. (D) Nrf2 target genes expression was evaluated by transcriptomic analysis and is presented as relative expression vs. KG1a cells or MSCs alone (n = 3). * p < 0.05.

