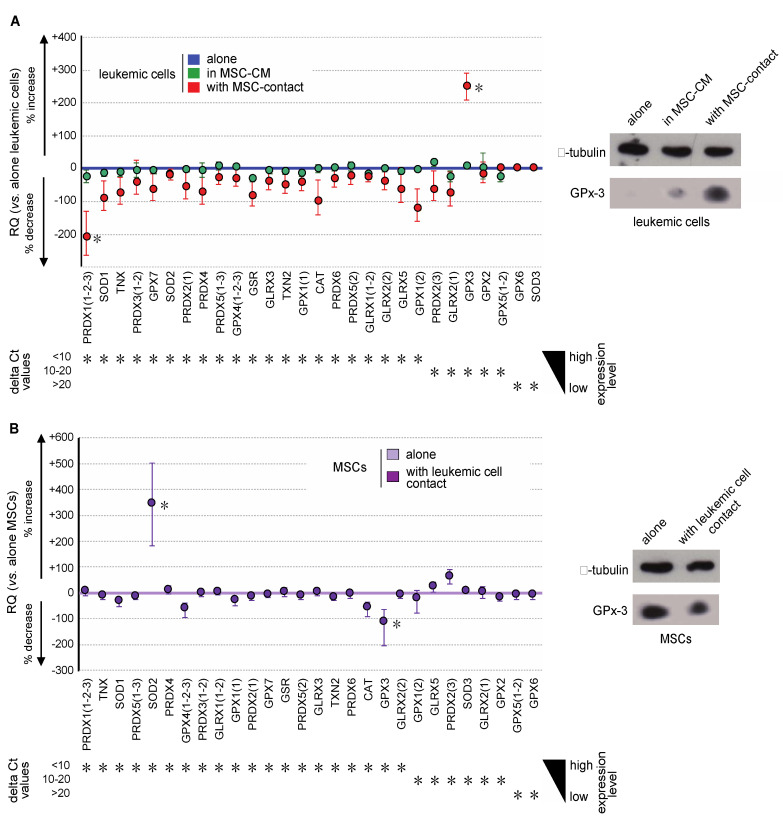
Figure 5.
Leukemic cells and MSCs reciprocally modify their gene expression profile of antioxidant enzymes. (A) Gene expression of the major antioxidant enzymes was analyzed by real-time PCR in KG1a cells and is presented, from the highest to the lowest expressed genes in KG1a cells, as the percentage of increased or decreased relative expression (RQ = 2−ΔΔCt) in KG1a cells cultured in MSC-CM (green dots) or cocultured with MSCs (red dots) vs. KG1a cells alone (blue line) (left). Increased GPX3 expression was studied at the protein level by Western blot analysis (right), alpha-tubulin being used as loading control. (B) Gene expression of major antioxidant enzymes was analyzed by real-time PCR in MSCs and is presented, from the highest to the lowest expressed gene in MSCs alone, as the percentage of increased or decreased relative expression (RQ = 2−ΔΔCt) in cocultured MSCs (violet dots) vs. MSCs alone (violet line) (left). Decreased GPX3 expression was confirmed at the protein level by Western blot analysis (right), alpha-tubulin being used as loading control. * p < 0.05.

