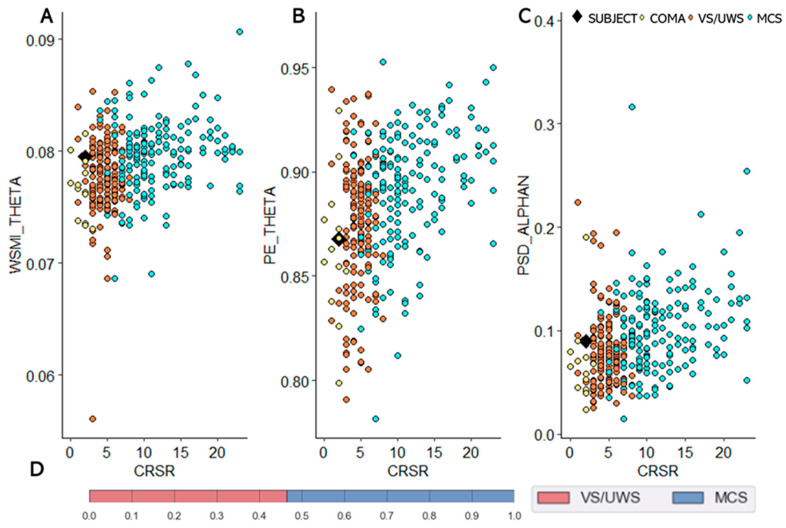
Figure 4.
Quantitative EEG analysis. 28 EEG biomarkers (i.e. connectivity, spectral, information theory) are extracted from high-density EEG recordings during an auditory novelty task. Their combination within a support vector machine (SVM) algorithm allows to discriminate patients in a minimally conscious state (MCS) from those in a vegetative state that is also coined unresponsive wakefulness syndrome (VS/UWS) [19,20,21] Example of key EEG markers, (A): mean weight symbolic mutual information (WSMI) in theta band, (B): mean permutation entropy (PE) in theta band, (C): mean power spectral density (PSD) normalized in alpha band. Each plot displays one metrics (Y axis) in relation to CRS-r score (X axis). Patient is plotted in black square, VS/UWS patients in orange dots, MCS patients in blue dots, and comatose patients in yellow dots. (D): Result of the SVM classifier (Grid search). The patient was classified as MCS.

