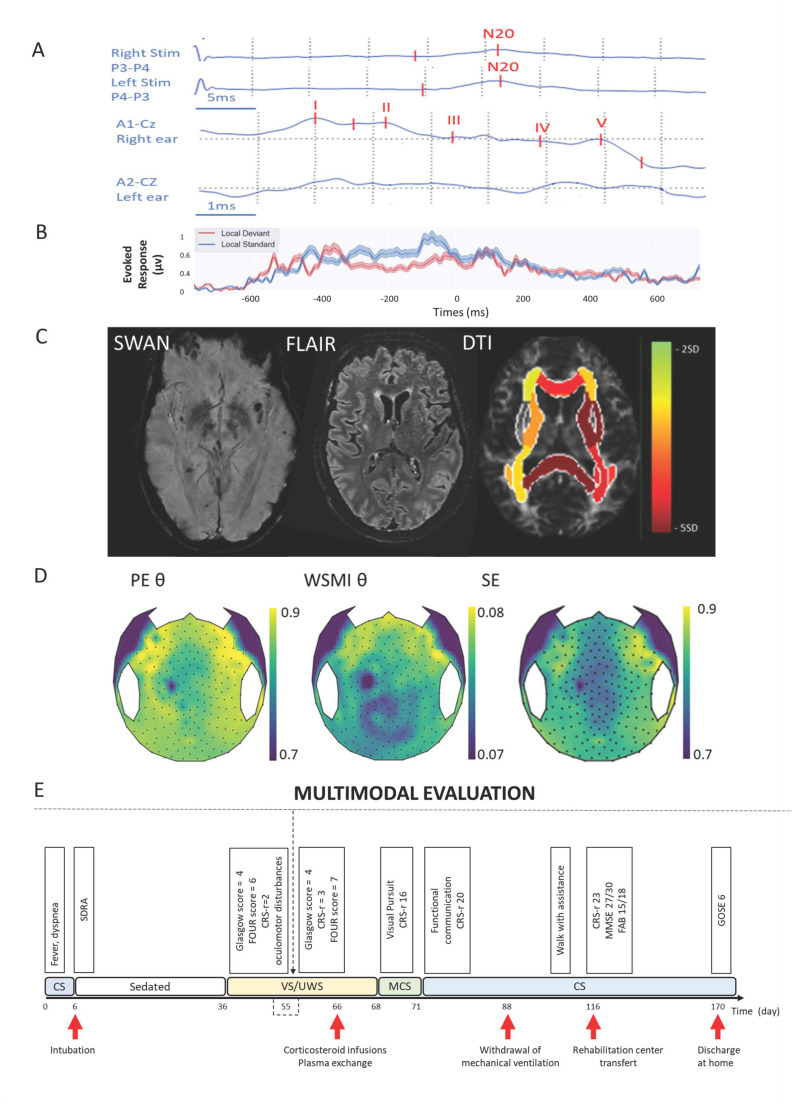
Figure 5.
Illustration of the multimodal evaluation that combined SSEP and BEAP (A), brain qualitative and quantitative MRI (B), cognitive ERP (C), quantitative hd-EEG (D) and repeated clinical evaluations (E). (A) From top to bottom, left and right SSEP showing bilateral cortical responses (N20), left and right BEAP sowing brainstem impairment. (B) Brain MRI from left to the right, SWAN, FLAIR and DTI sequences. (C) local effect plot of the” local-global” paradigm; Neither mismatch negativity (MMN) or P3b component were presents. (D) Topographical plots of quantitative EEG biomarkers extracted from hd-EEG recording. From left to the right, weight symbolic mutual information (WSMI) in theta band, permutation entropy (PE) in theta band, spectral entropy (SE). (E) Longitudinal clinical follow-up of the patient’s recovery according to different scores assessing vigilance, consciousness and cognitive function together with pivotal behavior. CRS-r: Coma Recovery Scale Revised: CS, Conscious State; FAB: Frontal Assessment Battery; FOUR: Full Outline of Unresponsiveness GCS: Glasgow Coma Scale; GOSE: Glasgow outcome scale extended, hd-EEG: high density Electroencephalogram; MCS: Minimally Conscious State; MMSE: Minimental State Examination, SDRA: acute respiratory distress syndrome, VS/UW: unresponsive wakefulness syndrome.

