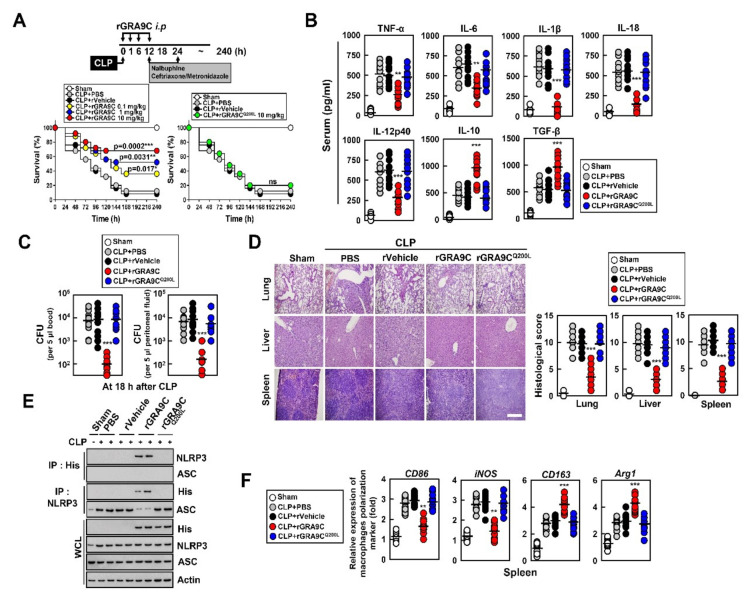
Figure 6.
rGRA9C prevents mice from CLP-induced septic shock. (A) Schematic of the CLP model treated with PBS, rVehicle, rGRA9 at the indicated concentrations or rGRA9CQ200L (upper). The survival of mice was monitored for 240 h; mortality was measured for n = 25 mice per group (lower). Statistical differences compared with the rVector-treated mice are indicated (log-rank test). The data are representative of two independent experiments with similar results. (B) Serum cytokine levels from 18 h after treatment of CLP mice with PBS, rVehicle, rGRA9C, or rGRA9CQ200L per group (n = 10 mice per group). (C) The bacterial burden was evaluated 18 h after treatment of CLP mice with PBS, rVehicle, rGRA9C or rGRA9CQ200L (n = 10 mice per group). (D) Representative hematoxylin and eosin (H&E) staining of the lung, liver and spleen (left) (n = 10 mice per group). Histopathology scores were obtained from H and E stained as described in methods (right) were determined at 30 h in CLP mice were treated with PBS, rVehicle, rGRA9, or rGRA9CQ200L. Scale bar, 500 μm. (E) Splenocytes were used for immunoprecipitation (IP) with αHis or αNLRP3, followed by immunoblotting (IB) with αNLRP3, αASC or αHis. WCLs were used for IB with αHis, αNLRP3, αASC or αActin. The data are representative of three independent experiments with similar results. (F) Splenocytes were used for quantitative real-time PCR with M1 (CD86 and iNOS) or M2 (CD163 or Arg1) macrophage polarization marker. Significant differences (* p < 0.05, ** p < 0.01; *** p < 0.001) compared with rVector-treated mice (A–C, D right, and F). Full-length images of the blots presented in the Figure S1.

