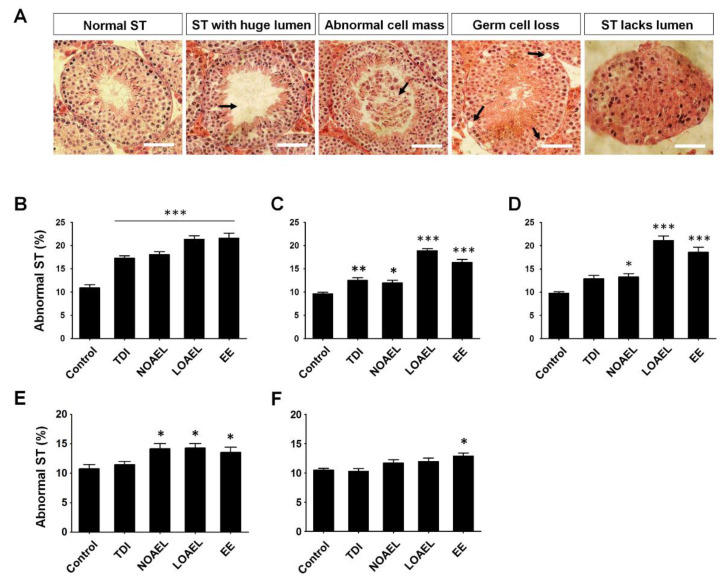
Figure 2.
Testicular cross section and the presence of abnormal seminiferous tubules (STs) due to bisphenol A (BPA) exposure. (A) Hematoxylin and eosin-stained testicular cross-sections presenting normal STs along with abnormal STs, characterized by a huge lumen (>40 µm in diameter), abnormal cell mass, loss of germ cells, and lack of lumen (pictures represent STs sections at PND 120). Arrows in the images indicate the positions of abnormality. Scale bar = 50 µm. Percentages of abnormal tubules are presented as bar graphs; (B) F1 offspring at PND 30 (n = 15 mice/group), (C) F1 offspring at PND 60 (n = 15 mice/group), (D) F1 offspring at PND 120 (n = 15 mice/group), (E) F2 offspring at PND 120 (n = 20 mice/group), and (F) F3 offspring at PND 120 (n = 15 mice/group). Data analyzed using one-way analysis of variance (ANOVA) where asterisk (*) indicate significant differences compared with control (* p < 0.05, ** p < 0.01, and *** p < 0.001).

