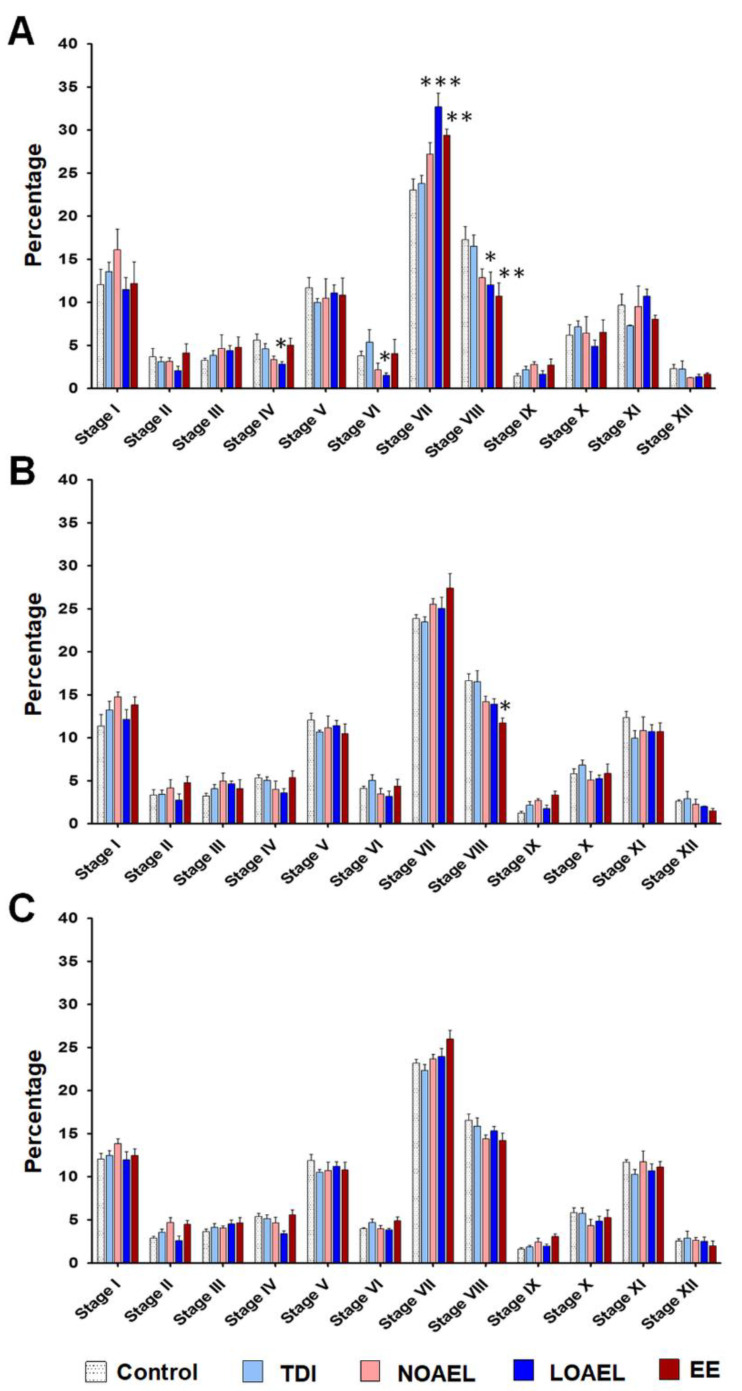
Figure 3.
Staging of the seminiferous epithelium (SE). Testicular sections were stained with periodic acid-schiff (PAS)-hematoxylin, followed by staging of the SEs to evaluate differences in SE staging upon BPA exposure. The bar graphs represent the staging patterns of (A) F1 offspring at postnatal day (PND) 120 (n = 20 mice/group), (B) F2 offspring at PND 120 (n = 15 mice/group), and (C) F3 offspring at PND 120 (n = 15 mice/group). For each stage, one-way analysis of variance (ANOVA) was used to identify significant differences between exposure and control groups (* p < 0.05, ** p < 0.01, and *** p < 0.001).

