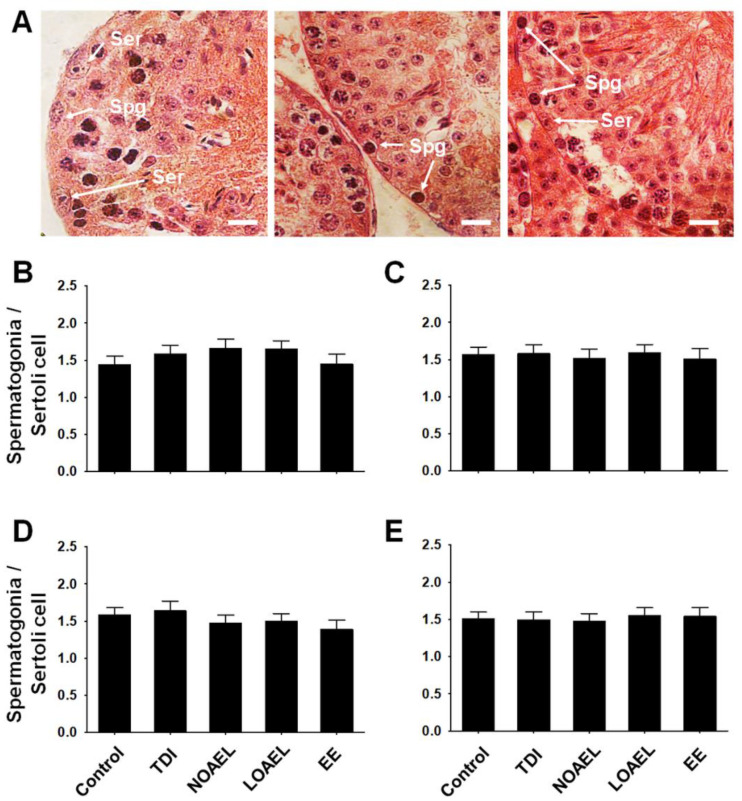
Figure 4.
Ratio of spermatogonia and Sertoli cells. The ratio of total number of spermatogonia and Sertoli cells in the same SE was measured. (A) Testicular cross-sections show spermatogonia (Spg) and Sertoli cells (Ser), which usually appeared at stages I-VI. Scale bar = 10 µm. Bar graphs represent the ratios of spermatogonia and Sertoli cells of (B) F1 offspring at PND 60 (n = 12 mice/group), (C) F1 offspring at PND 120 (n = 15 mice/group), (D) F2 offspring at PND 120 (n = 15 mice/group), and (E) F3 offspring at PND 120 (n = 15 mice/group), respectively.

