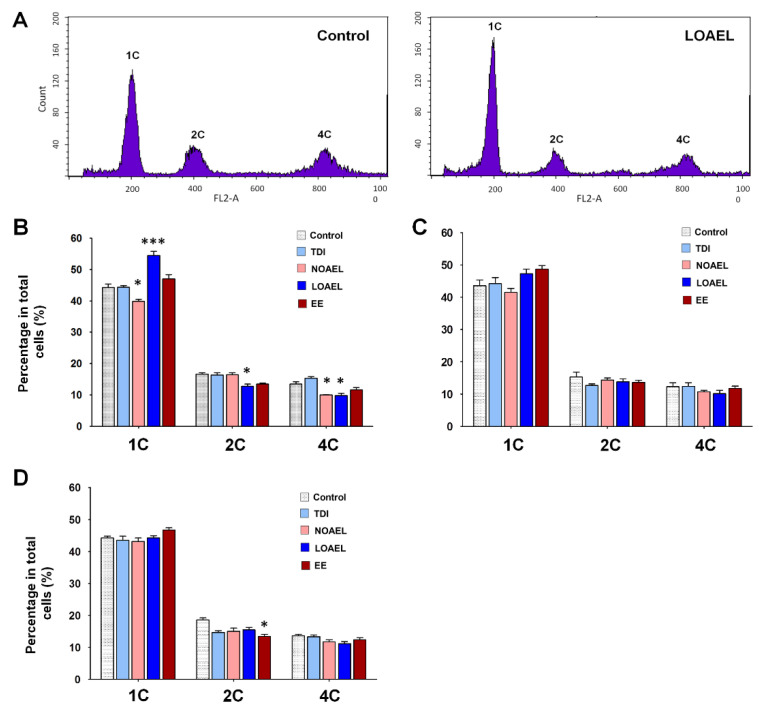
Figure 5.
Changes in the proportion of testicular cell populations upon bisphenol A (BPA) exposure. (A) Representative images of control and lowest-observed-adverse-effect-level (LOEAL) doses of BPA, derived using fluorescence-activated cell sorting (FACS). 1C, 2C, and 4C indicate the proportion of haploid (1C; total spermatid), diploid (2C; spermatogonia and secondary spermatocytes), and tetraploid (4C; primary spermatocytes and G2/M cells) germ cells in the testicle, respectively. (B), Bar graphs represent the percentage of haploid (1C), diploid (2C), and tetraploid (4C) germ cells among the total cells of F1 offspring (PND 120). (C,D) Percentage of germ cells (1C, 2C, and 4C) of F2 and F3 offspring are represented, respectively. Data were analyzed using one-way analysis of variance (ANOVA) where significant differences (*) have been calculated upon comparison of exposure groups with control group (n = 10 mice/group; * p < 0.05 and *** p < 0.001).

