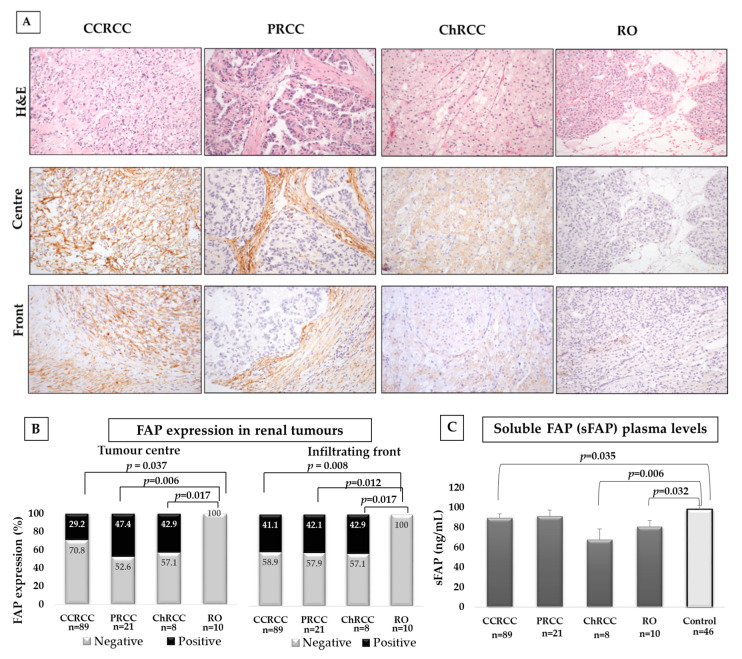
Figure 1.
Immunohistochemical fibroblast activation protein-α (FAP) staining in renal tumours and plasma levels of soluble FAP (sFAP) in renal tumour patients and control subjects. (A) Upper row shows haematoxylin-eosin staining of renal tumours. Middle and lower rows show FAP immunostaining at the tumour centre and border, respectively. Original magnification, ×250. (B) Renal cell carcinomas (RCCs) expressed FAP, whereas renal oncocytoma (RO) was negative. Staining was scored as negative or positive. Chi-square test was performed for comparisons in tumour tissues. (C) Soluble FAP (sFAP) was significantly lower in plasma samples from CCRCC and ChRCC patients than in controls. A Mann–Whitney U-test was used for comparisons in plasma samples.

