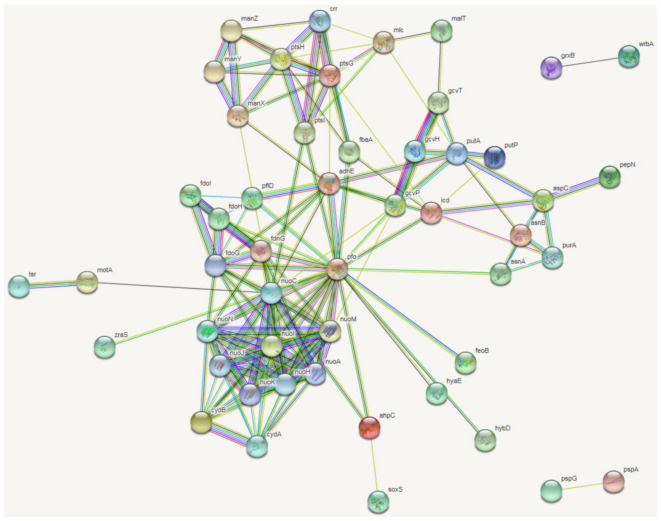
Figure 3.
Protein–protein interactions of E. coli ATCC25922 induced by sub-MICs of OLA generated following analysis of significantly different peptides input into the STRING database. The figure shows the protein–protein interactions networks that resulted from co-differentially expressed genes. “ ” represent known interactions from curated databases, “
 ” represent known interactions have been experimentally determined; “
 ” represent predicted interactions of gene neighborhood, “
 ” represent predicted interactions of gene fusions, “
 ” represent predicted interactions of protein homology. “
 ” represent interactions of gene textmining, “
 ” represent predicted interactions of gene co-expression, “
 ” represent interactions of gene co-occurrence.

