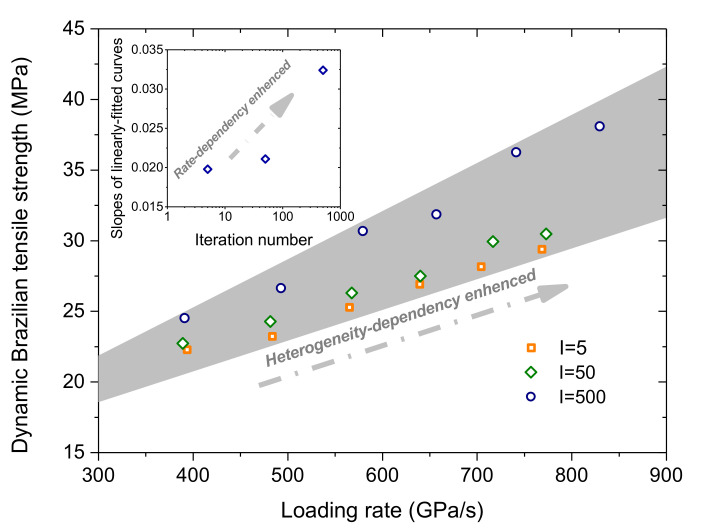
Figure 7.
Variation of the dynamic Brazilian tensile strength versus the loading rate considering different grain heterogeneity. The subfigure corresponds to the variation of the slope of the linearly fitted curve with respect to the iteration number. A larger slope stands for a stronger rate-dependency degree. For interpretation of the references to color in this figure, the reader is referred to the electronic version of this paper.

