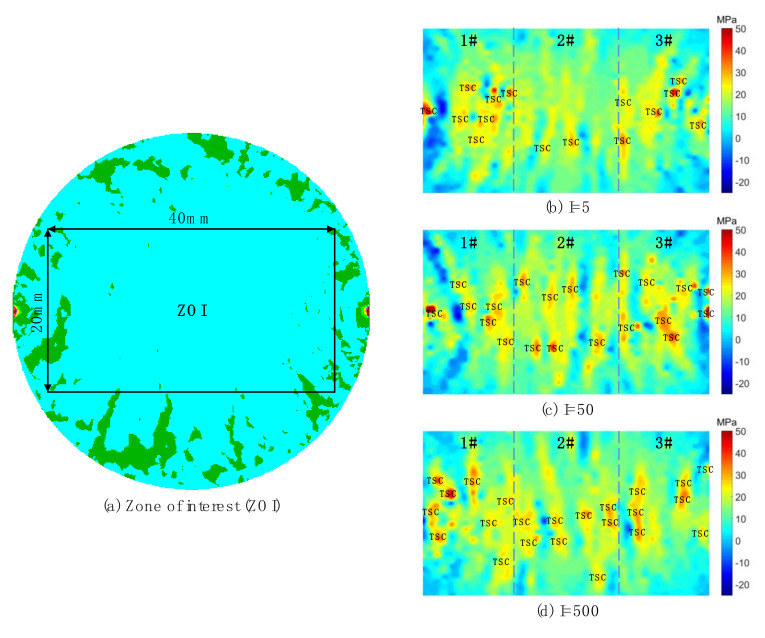
Figure 8.
Distributions of the minor principal stress inside samples with different grain heterogeneity when bearing the displacement of 0.1 mm between two loading points. (a) Zone of interest; (b) I = 5 and the loading rate = 394 GPa/s; (c) I = 50 and the loading rate = 389 GPa/s; (d) I = 500 and the loading rate = 391 GPa/s. The positive presents the tensile stress and negative denotes the compressive stress. For interpretation of the references to color in this figure, the reader is referred to the electronic version of this paper.

