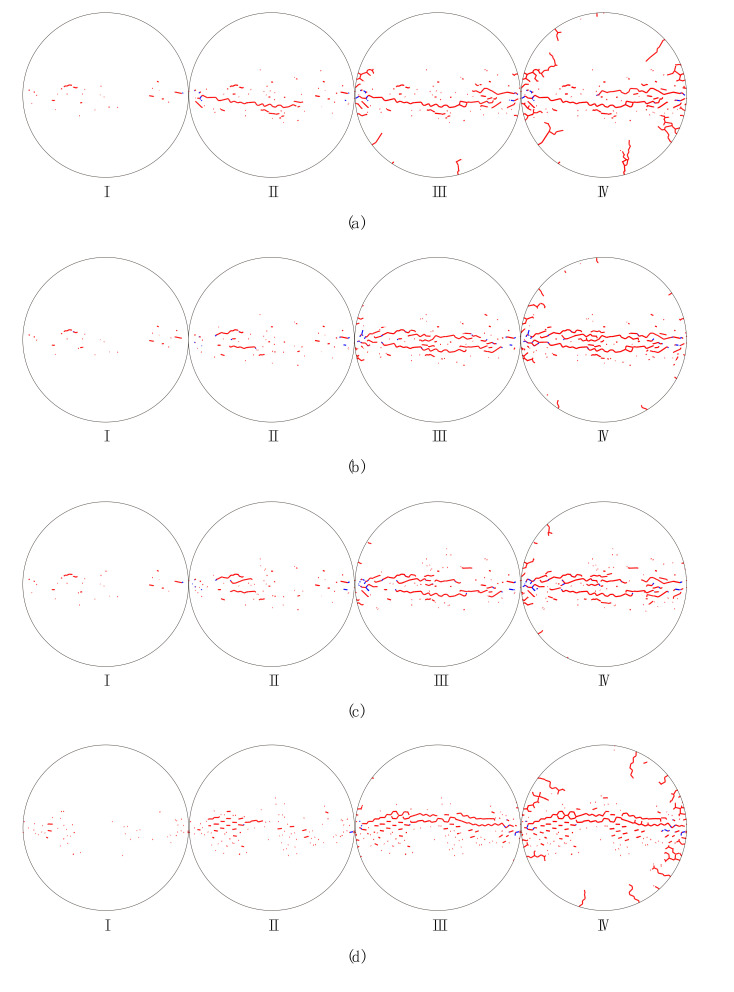
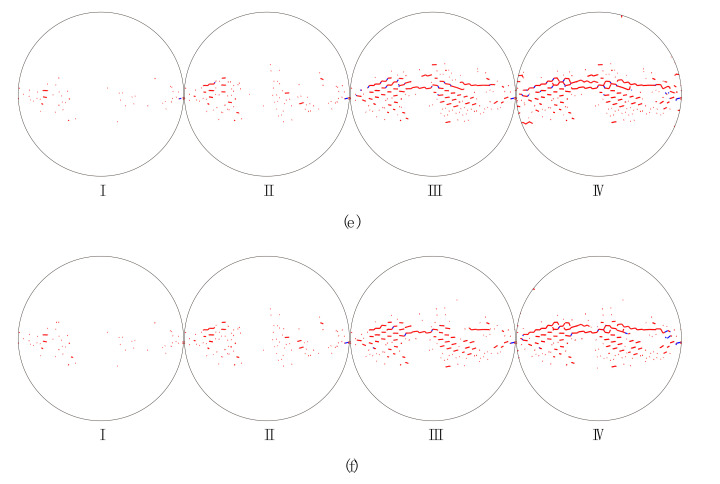
Figure 11.
Progressive failure process of the sample considering different loading rates of (a) 394 GPa/s (I = 5); (b) 565 GPa/s (I = 5); (c) 704 GPa/s (I = 5); (d) 391 GPa/s (I = 500); (e) 579 GPa/s (I = 500); (f) 741 GPa/s (I = 500). Stages I, II, III, and IV correspond to the displacement between two loading points 1, 1.25, 1.5, and 1.75 mm. The red and blue lines denote the tensile and shear micro cracks with respect. For interpretation of the references to color in this figure, the reader is referred to the electronic version of this paper.


