Figure 2.
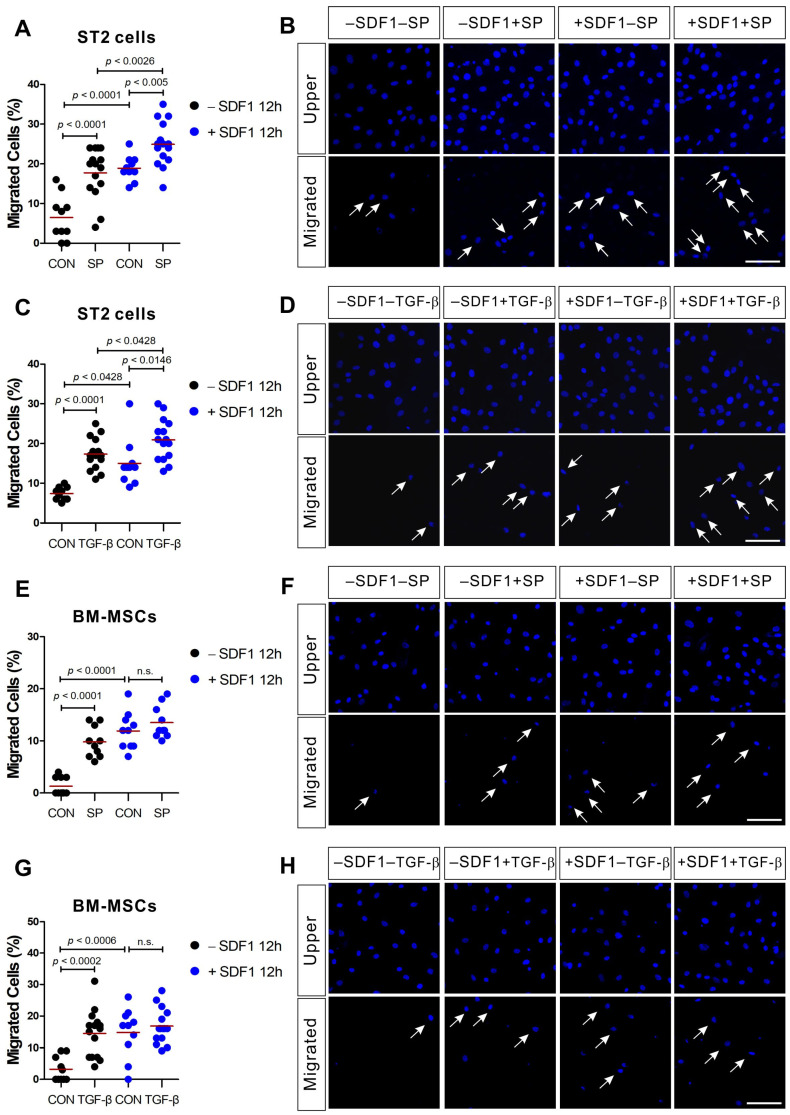
SDF-1 treatment enhances ST2 cell migration in response to SP and TGF-β, but not BM-MSC migration. ST2 cells or BM-MSCs were pretreated for 12 h with SDF-1 (+SDF1; blue dots) or solvent (−SDF1; black dots) prior to their application in a transwell migration assay using SP ((A,B) for ST2; (E,F) for BM-MSCs) or TGF-β ((C,D) for ST2; (G,H) for BM-MSCs) as stimulant. The control groups (CON) were treated with a solvent vehicle. White arrows indicate the migrated cells on the lower membrane surface. Cells were stained with DAPI (blue) and the number of migrated cells is shown as a percentage of the total. The red lines indicate the mean value (p values were obtained by t-tests. n.s.; not significant) and the scale bar represents 100 µm.

