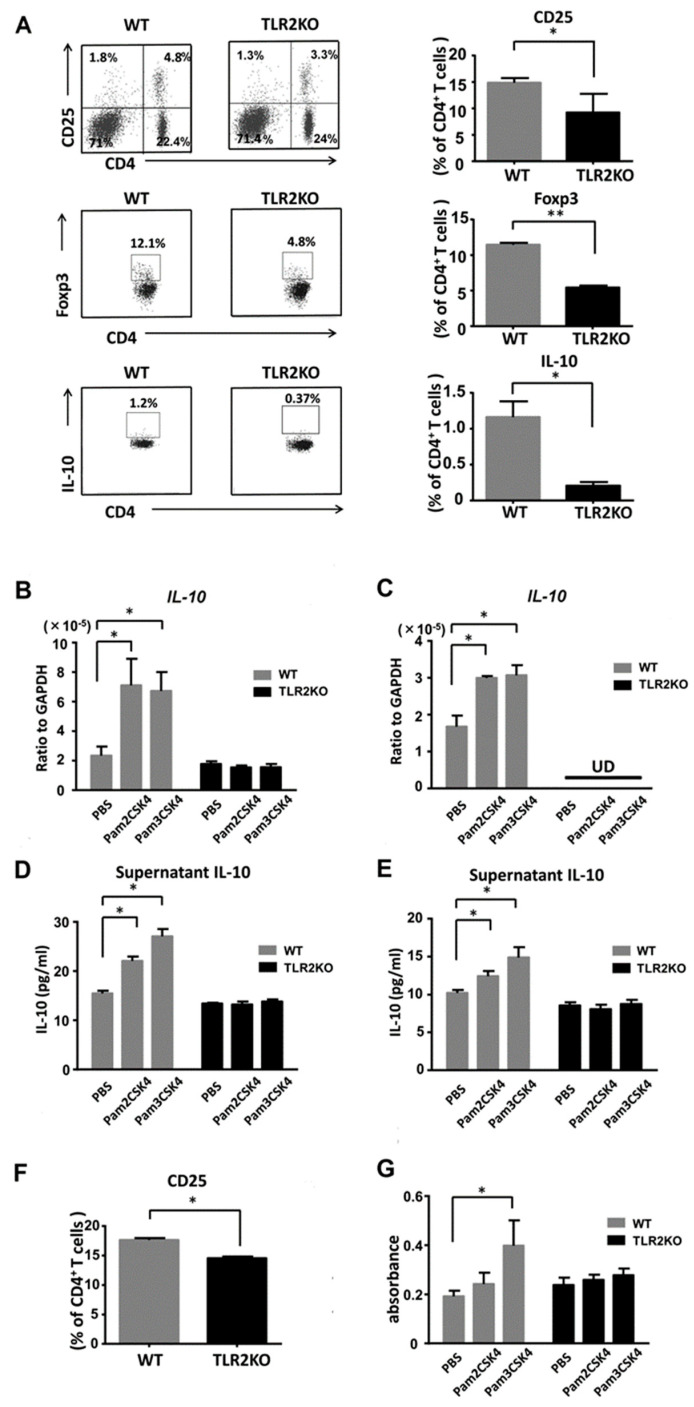
Figure 4.
TLR2 regulates proliferation of Tregs and IL-10 production by DCs and Tregs. Wild-type (WT) and TLR2 knockout (TLR2 KO) mice were treated as described. At day 2, cell suspensions from the draining lymph nodes were stimulated with PMA and ionomycin and were stained with antibodies specific for Foxp3 and IL-10 as well as CD4 and CD25 cell surface markers, followed by flow cytometric analysis. Flow plots show the CD25-positive, Foxp3-positive, or IL-10-positive population of the lymph nodes from WT and TLR2 KO mice. Flow plots were gated on CD4-positive cells (A). Data are representative of three independent experiments, where each group contains three mice. The right graphs show the frequency among CD4 cells in each group. Values are presented as mean ± SEM (n = 9). * p < 0.05, ** p < 0.01. IL-10 mRNA expression levels by DCs (B) and Tregs (C) stimulated with either Pam2CSK4 (TLR2/6 ligand) or Pam3CSK4 (TLR2/1 ligand). IL-10 concentrations in culture supernatants of DCs (D) and Tregs (E) stimulated with Pam2CSK4 or Pam3CSK4. (F) The frequency of CD25-positive cells among the CD4-positive cells analyzed by flow cytometry using skin draining lymph nodes from naïve TLR2 knockout (TLR2 KO) and wild-type (WT) mice. Data are representative of three independent experiments, where each group contains two mice. (G) BrdU cell proliferation analysis of Tregs from TLR2 KO and WT mice. Purified Tregs were cultured for 3 days with/without stimulation of Pam3CSK4 or Pam2CSK4. Values are presented as mean ± SEM of three independent experiments in triplicates. * p < 0.05, UD; undetectable.

