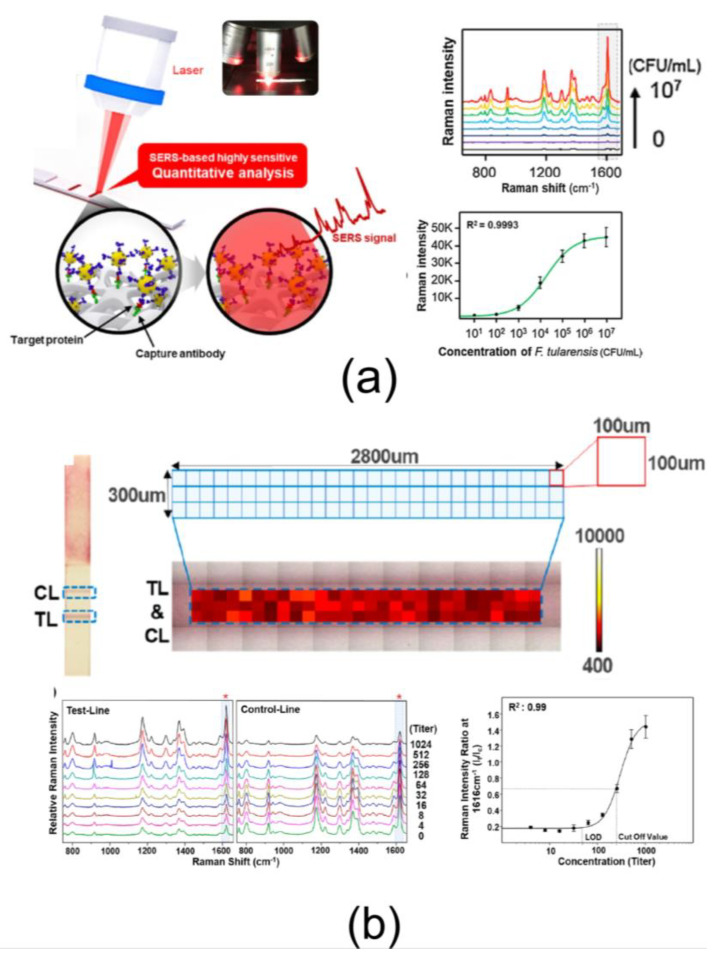
Figure 3.
(a) Using the SERS-based LFA strip and measuring the signal in separated points of T line quantitative analysis of a specific target can be performed. Quantitative SERS-based assay results for bacterial pathogen F. tularensis. The assays were performed in the 0–107 CFU/mL range and corresponding calibration curves for different concentrations of the bacterial pathogen. Reproduced with permission from [31]. (b) Schematic illustration of the Raman data collection process. The mapping area for the test and control lines. A total of 84 pixels were imaged with 100 μm intervals. Average SERS spectra of 84 pixel points for different titer concentrations of O. tsutsugamushi-specific IgG antibodies on the test and control lines. Corresponding standard calibration curve for different titer concentrations of the antibodies. Reproduced with permission from [24].

