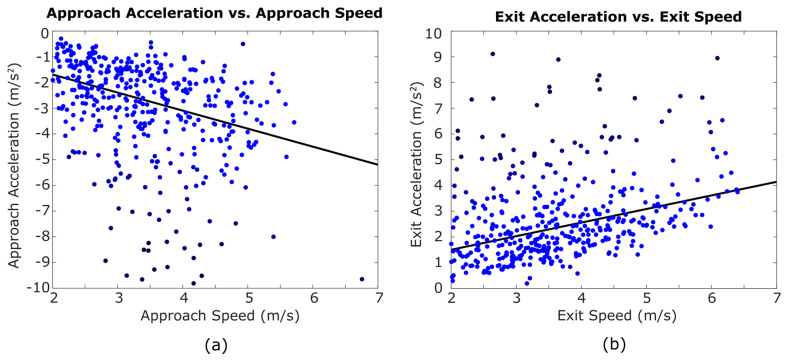
Figure 6.
A linear regression model was applied to each data set to generate trend lines. Both approach (a) and exit (b) accelerations increased in magnitude with higher approach and exit speeds. Iterative weighted robust fitting was used to reduce the influence of outliers. Outliers were shaded darker than data closer to the trend line. 13 acceleration and 4 speed outliers are outside this view.

