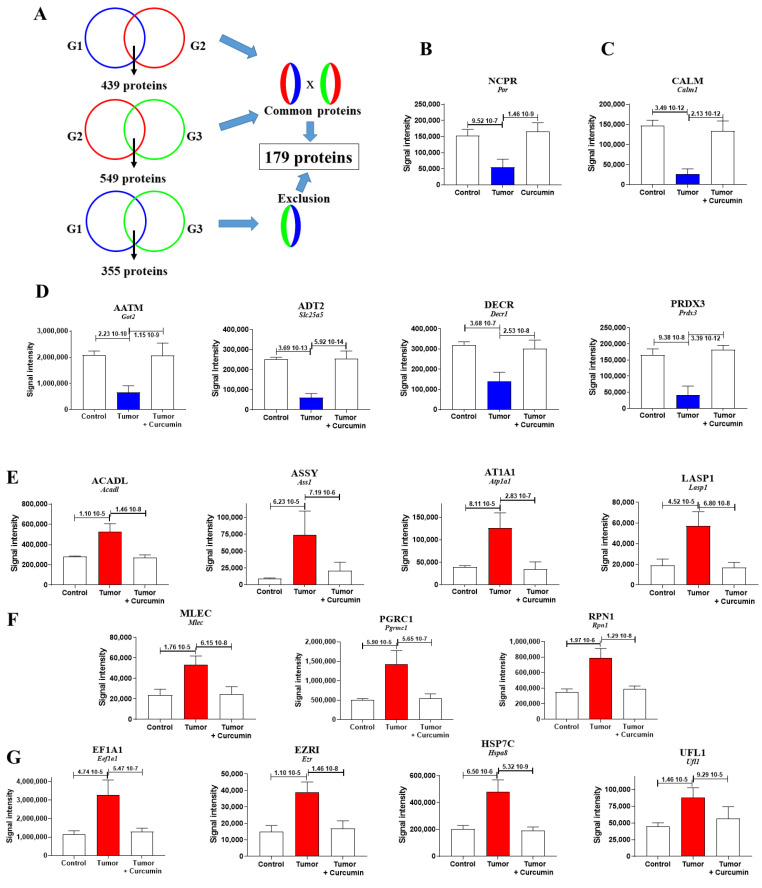
Figure 3.
Liver biomarkers exhibiting the most dramatic quantitative changes under metastatic colonization by M5-T1 cells. (A) Diagram of the method used to identify the 179 biomarkers of interest. G1 = group of normal rats, G2 = group of untreated rats, G3 = group of curcumin-treated rats. (B–D) Biomarkers exhibiting the most dramatic changes within the 61 proteins presenting a decreased abundance, located in endoplasmic reticulum (B), cytoplasm and cytoskeleton (C), and mitochondria (D). (E–G) Biomarkers exhibiting the most dramatic changes within the 118 proteins presenting an increased abundance, located in mitochondria, cytoplasm or plasma membrane (E), endoplasmic reticulum (F), or present in multiple subcellular compartments (G).

