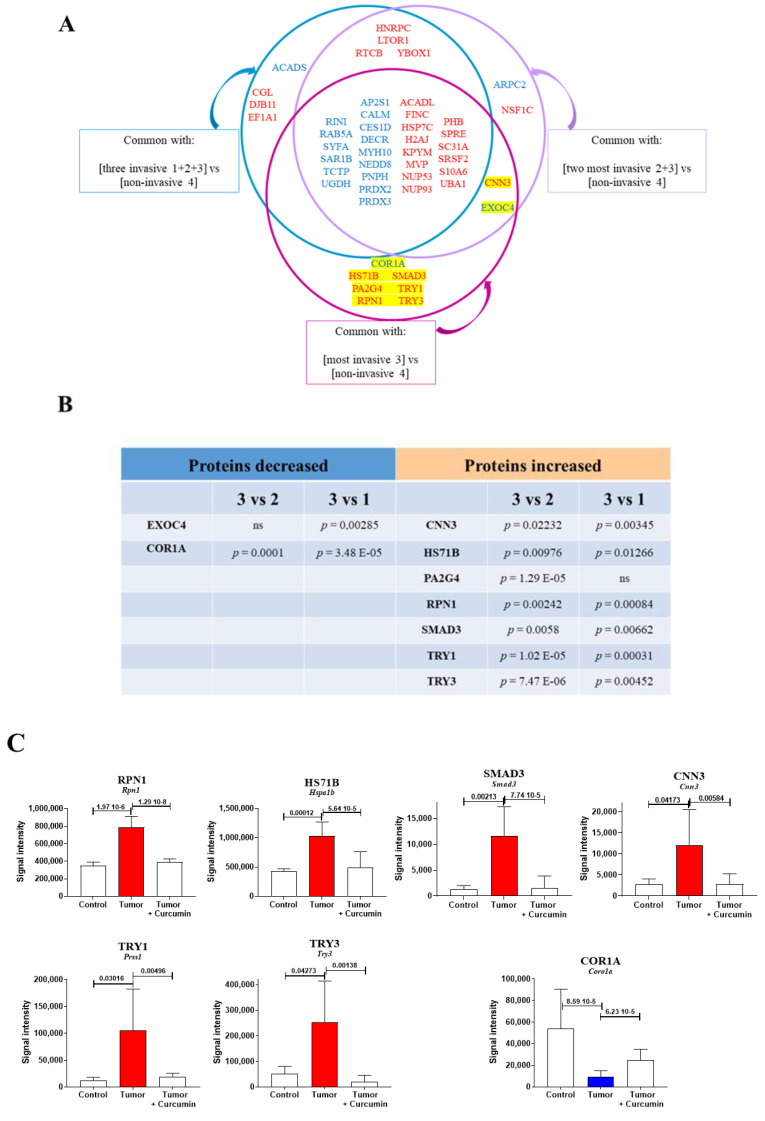
Figure 6.
Common biomarkers of liver colonization by M5-T1 cells and the M5-T1 tumor. (A) Schematic representation of the method used to identify biomarkers common to the liver colonization by M5-T1 tumor cells and invasive rat mesothelioma tumors. The lists of proteins common to each condition are written in blue (for decrease) and red (for increase). The codes describing each invasive rat mesothelioma tumors were: 1 = F4-T2, 2 = F5-T1, and 3 = M5-T1 (4 = noninvasive M5-T2). As in Figure 3, Figure 4 and Figure 5, the equivalent human genes that encode the proteins represented by abbreviations (for the rat) are given in Tables S1 and S2. (B) The p-values for the nine biomarkers identified in (A), highlighted in yellow (MarkerView statistical analysis) when comparing abundance changes in 3 vs. 1 and 3 vs. 2 (same codes for the rat tumors as above). (C) Comparison of protein abundances between the three groups of rats (significant increases in red and decreases in blue, with p-values indicated above bars) for the seven biomarkers satisfying the condition p < 0.05 in the two tests described in (B).

