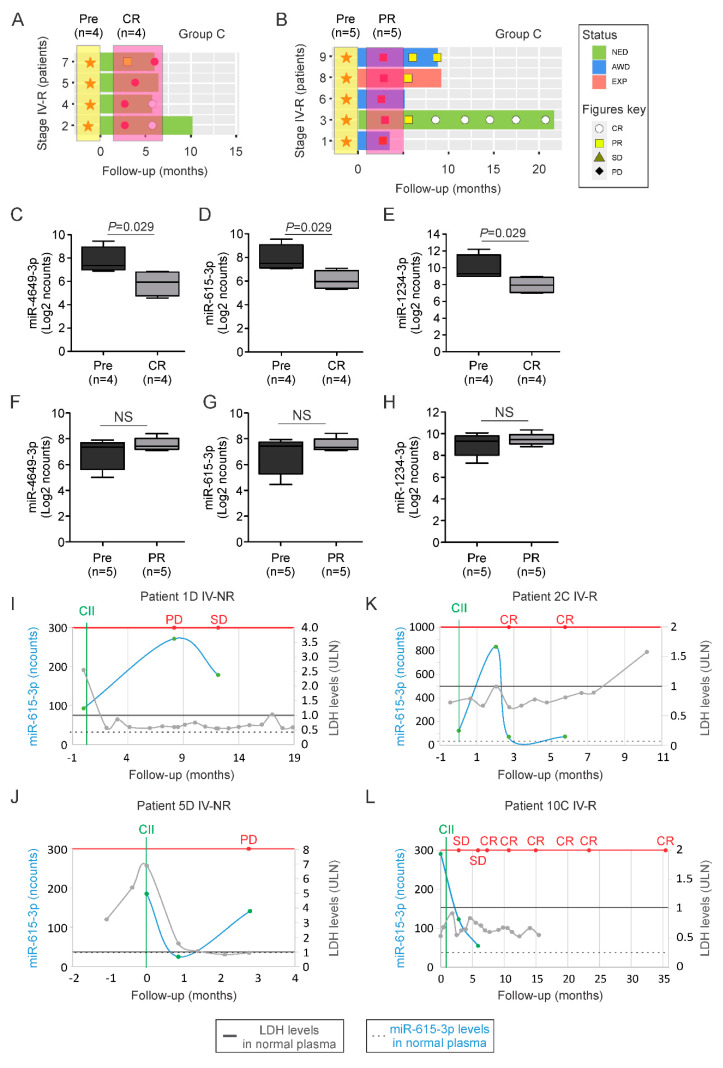
Figure 3.
Validation of cfmiRs identified in assessing patient response to CIIs. (A,B) Disease status in stage IV patients who had a complete response (A, CR) or partial response (B, PR). Orange stars indicate pre-treatment (Pre) plasma samples. Red circles indicate blood collected in patients at CR. Red squares indicate blood collected in patients at PR. (C–E) Boxplots showing the changes in miR-4649-3p (C), miR-615-3p (D), and miR-1234-3p (E) levels in patients who achieved a CR (p values are indicated on top) compared to pre-treatment samples. (F–H) Boxplots showing the changes in miR-4649-3p (F) and miR-615-3p (G), and miR-1234-3p (H) levels in patients who achieved PR compared to pre-treatment samples (NS, non-significant). (I–L) Graph showing four melanoma patients: stage IV non-responder (IV-NR) patient 1D (I) or patient 5D (J); stage IV responders (IV-R) patient 2C (K) or patient 10C7 (L). Shown is the follow-up in months, LDH levels (labeled as light gray), and miR-615-3p levels (labeled as light blue; normalized counts, ncounts) at the indicated time points. Red line points to RECIST 1.1. Gray solid line indicates the upper limit normal (ULN) for LDH. Black dotted line indicates the average level of miR-615-3p detected in normal healthy donors’ plasma samples. Green solid line indicates the start of CII.

