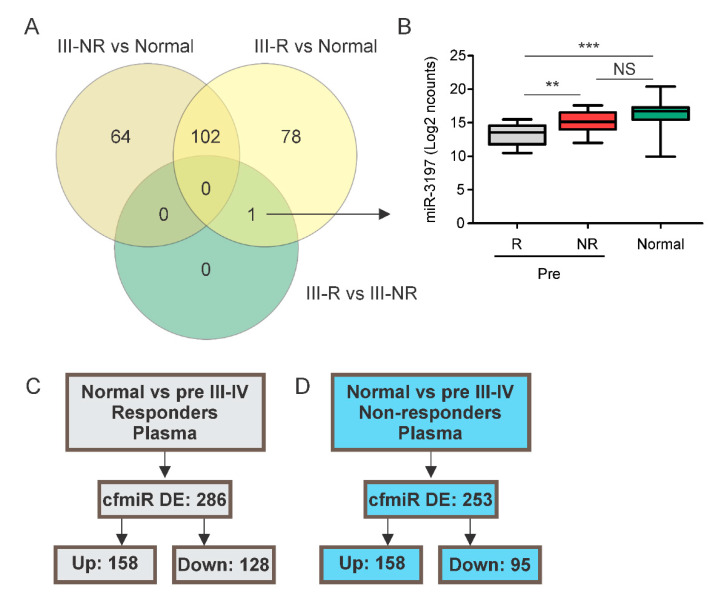
Figure 4.
Characterization of cfmiRs in stage III melanoma patients. (A) Venn diagram showing the number of cfmiRs found in each comparison: stage III non-responders versus normal donors (III-NR vs. N); stage III responders versus normal donors (III-R vs. N); stage III responders versus non-responders (III-R vs. III-NR). (B) Boxplot showing the levels of miR-3197 in stage III responders (R), non-responders (NR), and normal donors’ plasma samples. (** p < 0.01, *** p < 0.001, NS, non-significant). (C) Shown are the DE cfmiRs in normal donors’ versus pre-treatment plasma samples from stage III/IV responder melanoma patients. (D) Shown are the DE cfmiRs in normal donors versus pre-treatment plasma samples in stage III/IV non-responders melanoma patients.

