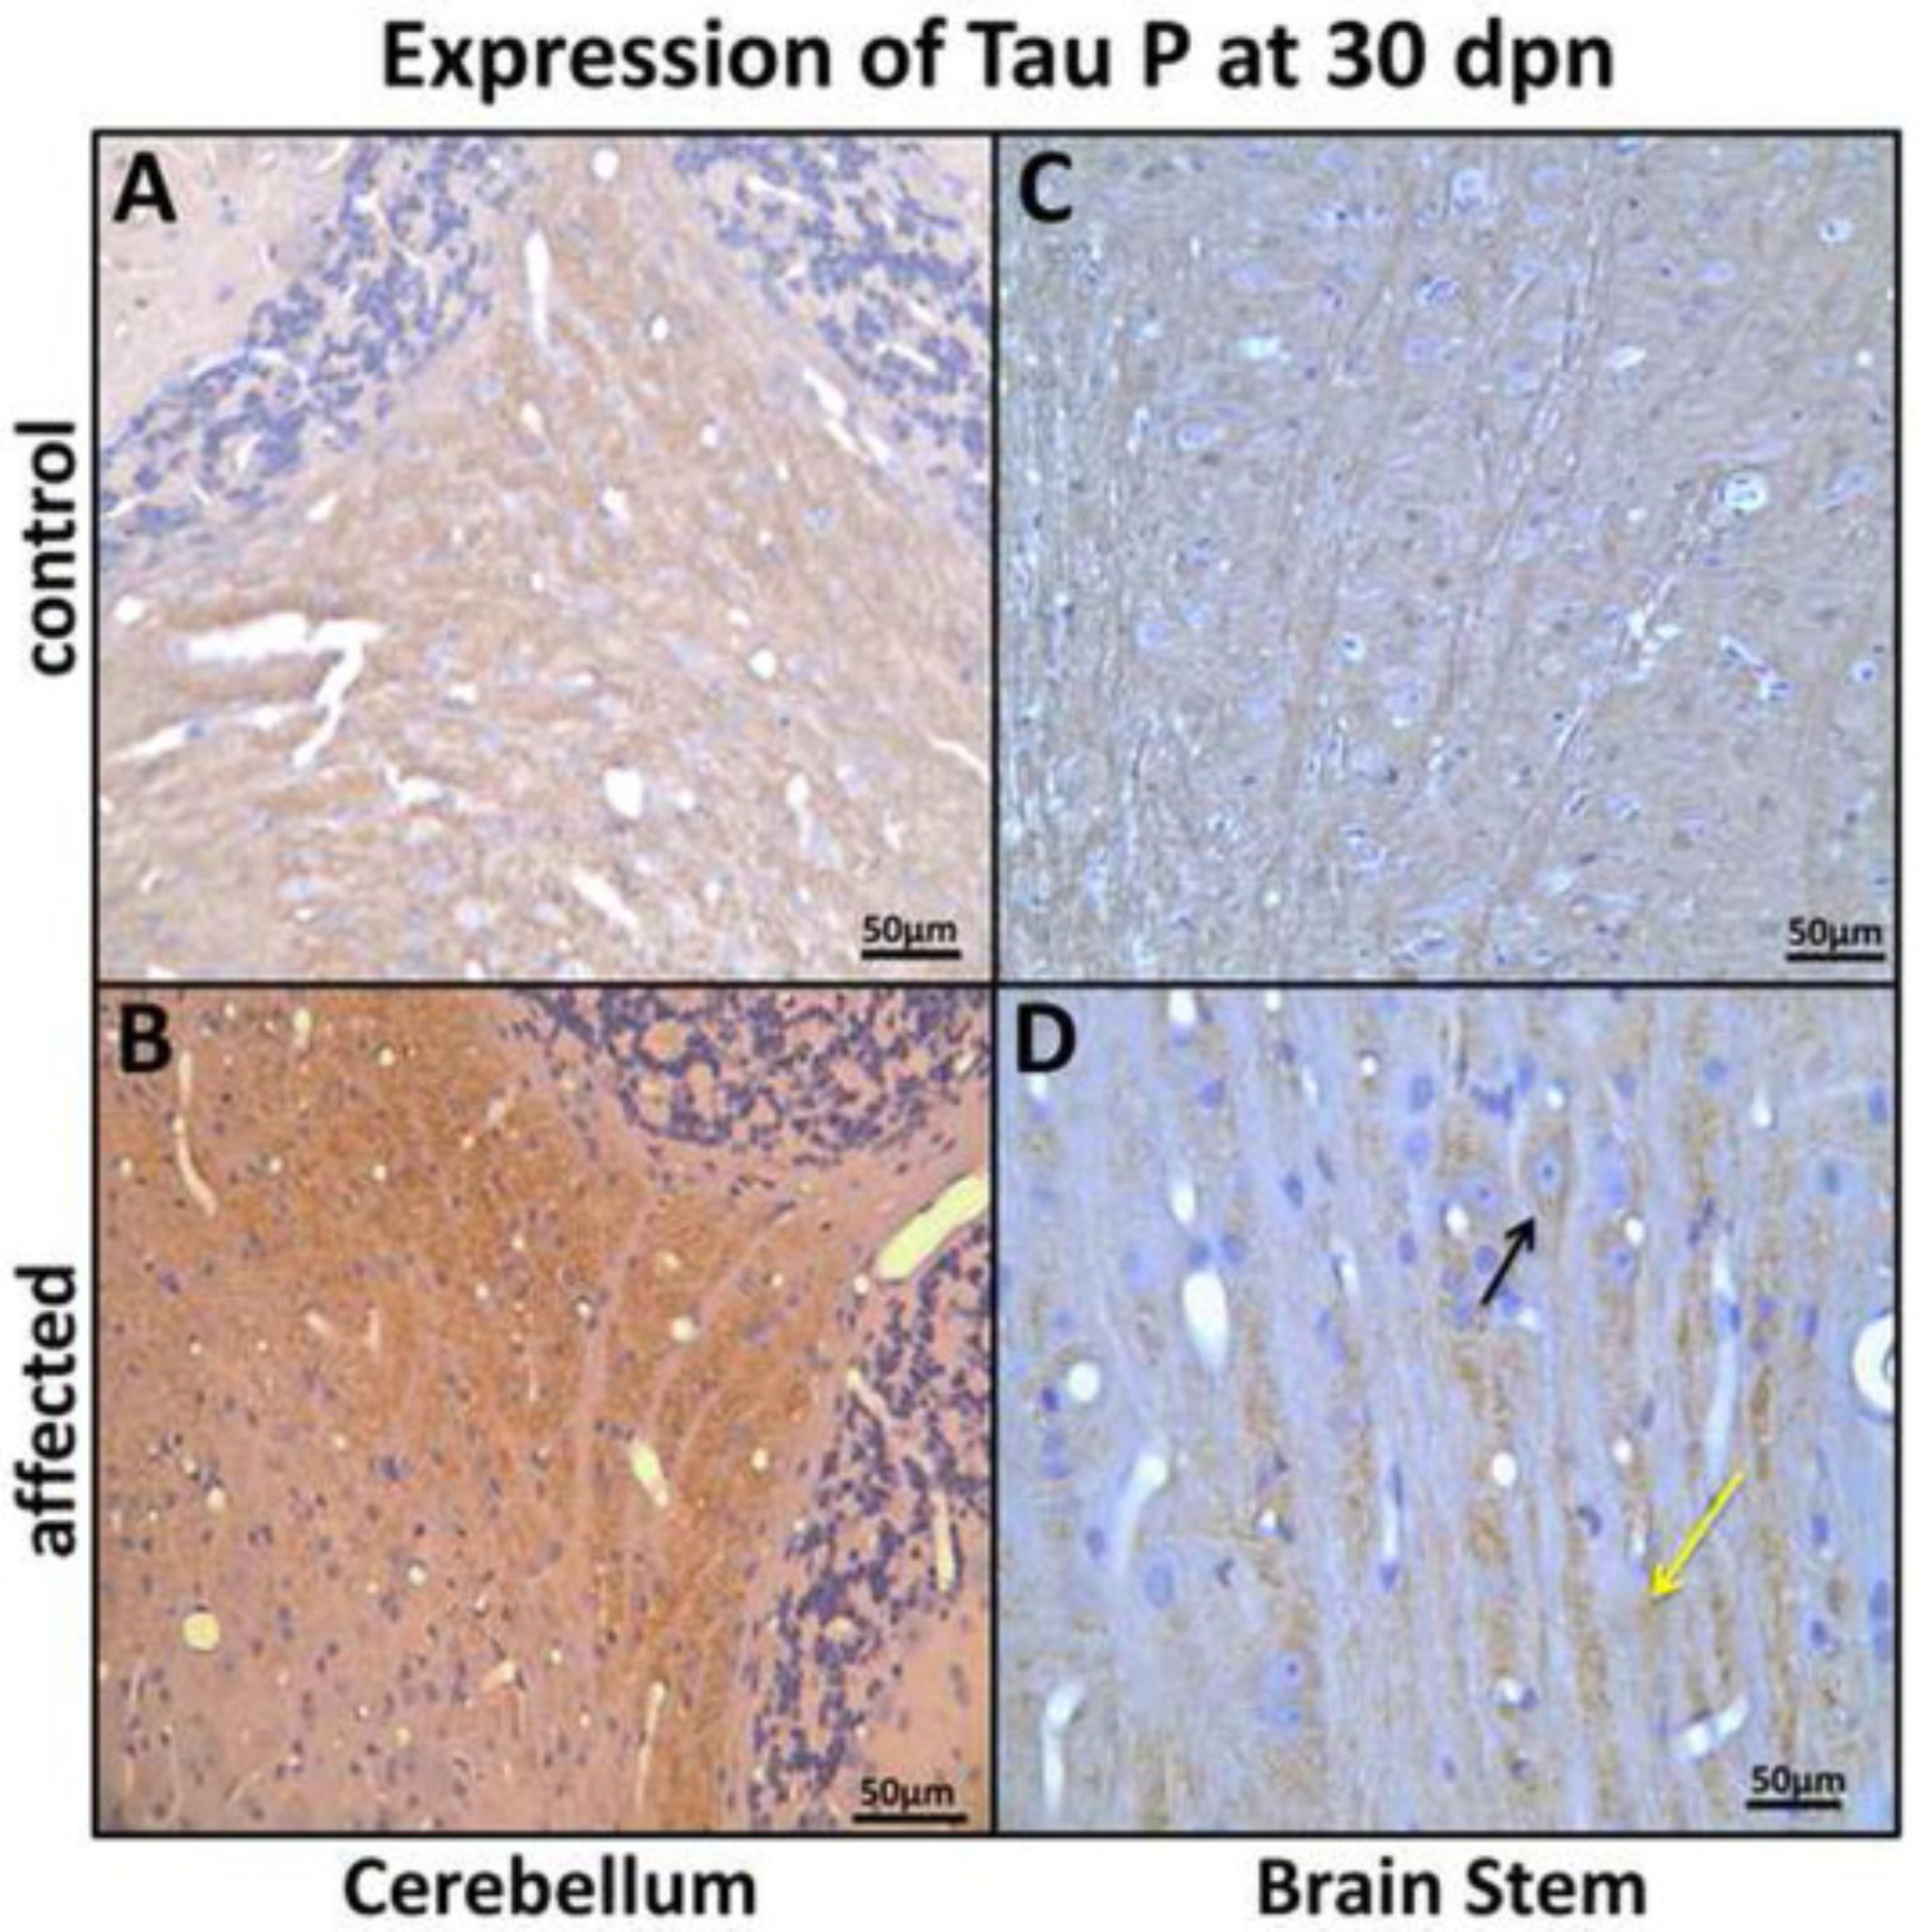
Fig. 9.

Expression of tau P in cerebellum nuclei (CR), and brain stem (BS) at 30 dpn. (A) CR nuclei from a control rat showing weak tau-P labeling and (B) an affected rat showing strong tau-P labeling in the CR nuclei (Bar = 50 μm). (C) BS pontocerebellar fibers showing weak immunolabeling in control and (D) showing strong tau-P labeling, perikaryal (black arrow) and axonal (yellow arrow) in affected rats. (Bar = 50 μm).
