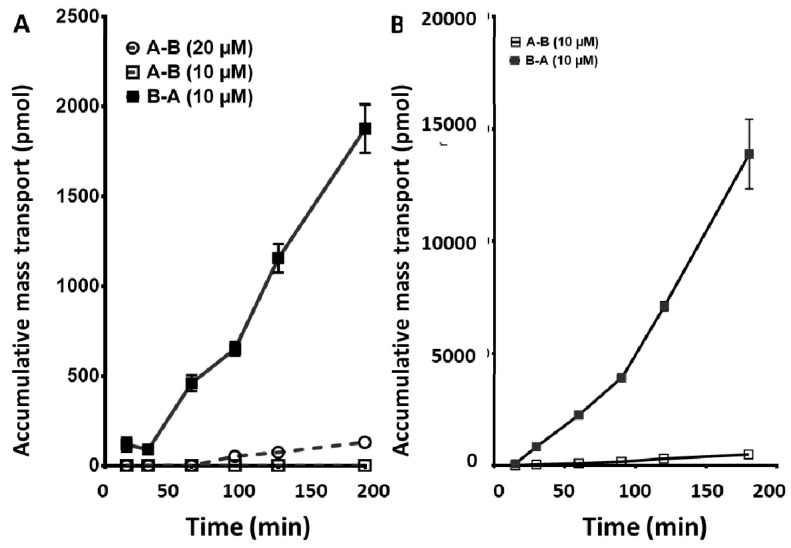
Figure 5.
Cumulative mass transport of crizotinib (A) and dasatinib (B) across a CaCo2 monolayer. Crizotinib was tested at 10 and 20 µM. At 10 µM, crizotinib no A–B transport was detected, most likely due to the sensitivity of the assay used for determination of the concentration. At a higher concentration (20 µM), minimal A–B transport was observed but was still 20-fold lower than mass transport observed in the B–A direction at the 10 µM dose level. Dasatinib was tested at 10 µM. All values are the mean ± standard error of the mean 3 or more replicates. When not visible, the error bars are within the size of the marker.

