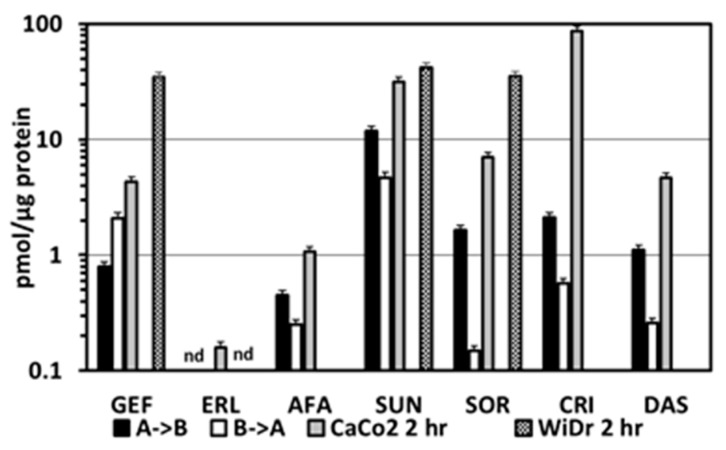
Figure 6.
Accumulation of the TKIs in CaCo2 cells harvested at the end of the mass transport experiments in comparison to TKI accumulation in CaCo2 cells and WiDr colon cancer both grown as normal monolayers. These cells were exposed to 20 μM of a TKI and were harvested after 2 h for determination of TKI concentration with LC-MS-MS. Values are means ± SEM for the number of experiments described in Figure 3, Figure 4, and Figure 5 and from three separate experiments for the monolayer CaCo2 and WiDr cells. GEF, gefitinib; ERL, erlotinib; AFA, afatinib; SUN, sunitinib; SOR, sorafenib; CRI, crizotinib; DAS, dasatinib; nd, not detectable. A->B, mass transport from A to B; B->A, mass transport from B to A. For AFA, CRI, and DAS, no data in WiDr cells were available.

