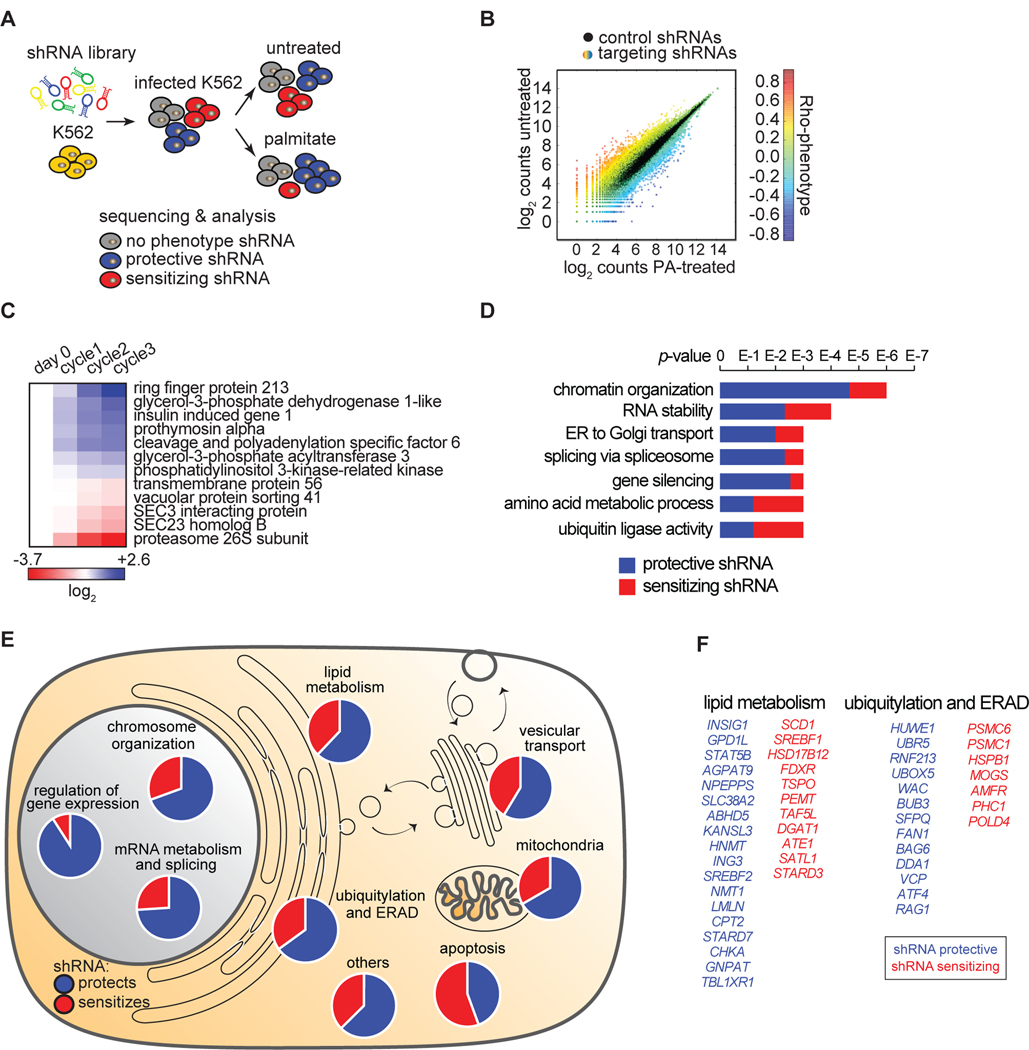
Figure 3. Identification of Genes that Modify Lipotoxicity in K562 Human Leukemia Cells.
(A) Schematic of shRNA screen. K562 cells were infected with a complex lentiviral shRNA library (25 shRNAs/gene) as described in Methods. Cells were split into treated (0.2 mM palmitate) and untreated (control) samples. Upon five cycles of palmitate treatments, shRNAs were amplified by PCR and sequenced. Expected outcome: cells enriched in palmitate-treated sample (infected by protective shRNAs) are shown in blue, cells de-enriched in palmitate-treated sample (infected by sensitizing shRNAs) are shown in red, and cells equally present in treated and untreated samples (infected by shRNAs having no phenotype) are shown in grey.
(B) The screen output is shown. The absolute count for each shRNA from sequencing is shown as a dot. Each dot is the average among the biological replicate screens. Black dots are control shRNAs. Color-coded dots are targeting shRNA. The color varies according to the different phenotype.
(C) Screen candidates are confirmed by independent validation. The three shRNA-targeting sequences having the strongest phenotypes in the screen were cloned individually and then used to generate a stable knock-down for each of the 12 genes in the figure. To validate each candidate, we performed a growth competition assay between the knock-down cells (m-Cherry positive) and control cells (m-Cherry negative). The color code shows the enrichments in blue (for protective shRNAs) and de-enrichments in red (for sensitizing shRNAs) of knock-down cells compared to control cells upon three consecutive cycles of palmitate treatment. Flow cytometry was used to quantify each knockdown population. The variation, quantified after each individual palmitate treatment (cycle) compared to controls (day 0), is expressed as log2.
(D) Annotation of overrepresented terms identified among the screen candidates. Candidates are designated as genes that sensitize (red) or protect (blue) cells from palmitate-induced cell death. The analysis was performed using ClueGO in Cytoscape.
(E) Overview of screen results. The 355 genes targeted by the 234 protective shRNAs (in blue) and 121 sensitizing shRNAs (in red) are shown grouped by categories. Information on these genes is also presented in Table S3 “Screen result table”.
(F) Of the 355 genes identified, 29 genes were involved in lipid metabolism and 20 were involved in ubiquitylation and ERAD.
See also Figures S3.

