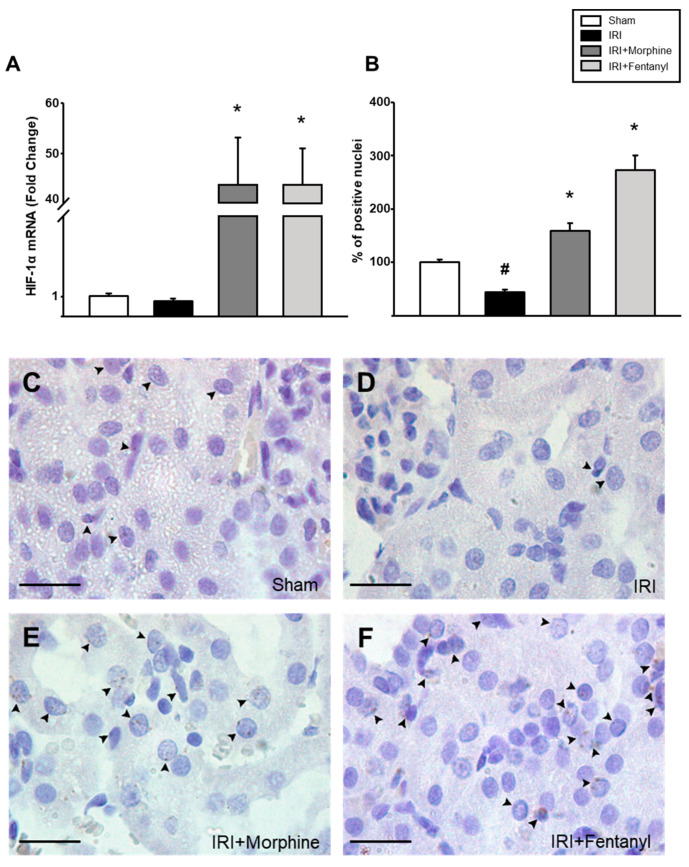
Figure 3.
Opioid preconditioning promoted HIF-1 expression. (A) HIF-1α mRNA expression was analyzed by real-time PCR in the ischemia-reperfusion treated kidneys. Immunohistochemistry was performed in the ischemia-reperfusion treated kidney slides and the number of positive signal nuclei was quantified at 100× (B) from sham group (C), IRI (D), morphine- (E) and fentanyl-preconditioned animals (F). The average count of positive nuclei in the sham group was set as 100%. Sham group is represented by the white bars, IRI by the black bars, IRI + morphine by the dark gray bars, and IRI + fentanyl by the light gray bars. Scale bars represent 20 µm. Values are means ± S.E.M. (n = 6). # p < 0.05 vs. sham, * p < 0.05 vs. IRI.

