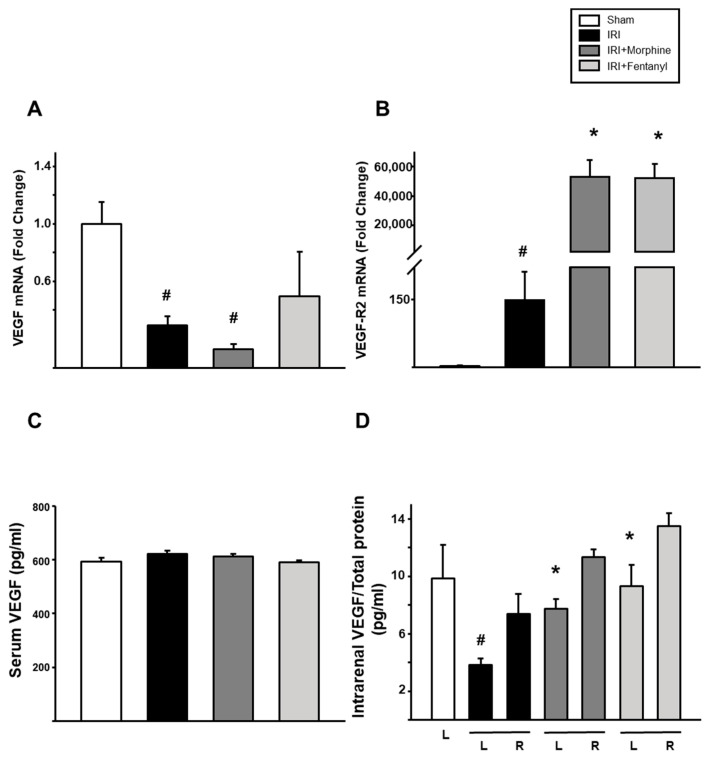
Figure 4.
Opioid preconditioning modulated VEGF an VEGF-R2 expression. Quantitative RT-PCR evaluation of mRNA levels of VEGF (A) and VEGF-R2 (B) in the ischemia-reperfusion treated left kidneys. Circulating (C) and intrarenal (D) levels of VEGF in the ischemia-reperfusion treated left kidneys (L) and the nontreated right ones (R). Levels were normalized using total protein quantification. Sham group is represented by the white bars, IRI by the black bars, IRI + morphine by the dark gray bars, and IRI + fentanyl by the light gray bars. Values are means ± S.E.M. (n = 6). # p < 0.05 vs. sham left (L) kidney. * p < 0.05 vs. IRI left kidney.

