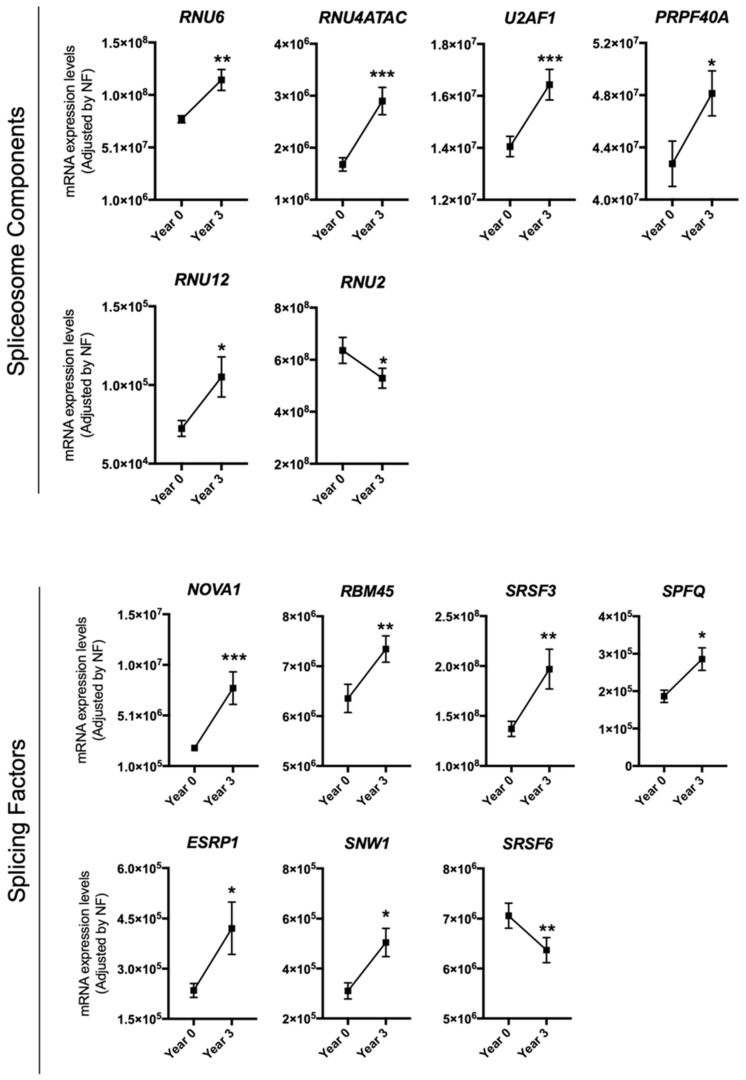
Figure 1.
Peripheral blood mononuclear cells (PBMCs) expression pattern of specific splicing machinery components after three years of follow-up. mRNA expression levels (adjusted by a normalization factor (NF) calculated from the expression level of GAPDH and ACTB) of specific spliceosome components and splicing factors in the PBMCs from all participants included in the study. Values represent the mean ± standard error of the mean (SEM). Asterisks indicate values that significantly differ from non-type 2 diabetes mellitus (T2DM) subjects (t-test: *, p < 0.05; **, p < 0.01; ***, p < 0.001).

