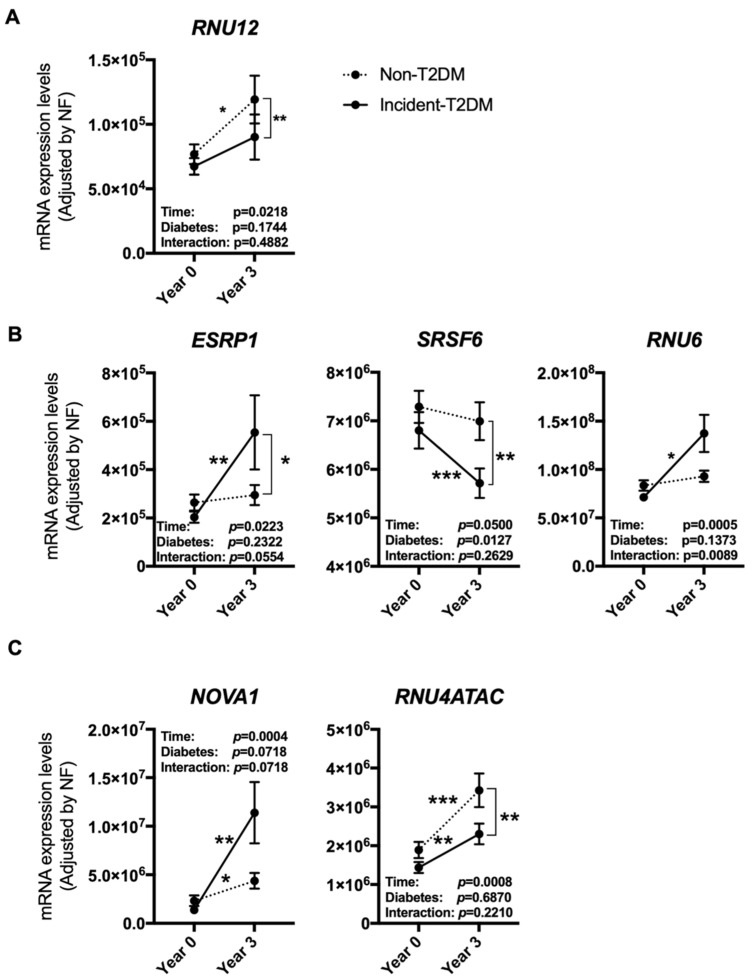
Figure 3.
PBMCs expression pattern of specific splicing machinery components after three years of follow-up in non-T2DM and incident-T2DM subjects. Splicing machinery components altered in non-T2DM subjects (A), incident-T2DM subjects (B) or both (C). mRNA expression levels [adjusted by a normalization factor (NF) calculated from the expression level of GAPDH and ACTB] of specific spliceosome components and splicing factors in the PBMCs from all the participants included in the study. Values represent the mean ± SEM. Asterisks indicate values that significantly differ from non-T2DM subjects (t-test: *, p < 0.05; **, p < 0.01; ***, p < 0.001).

