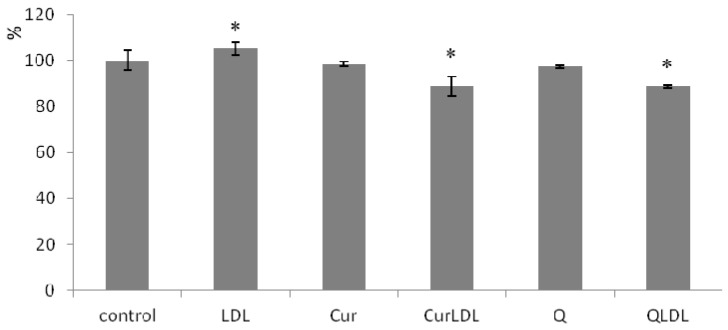
Figure 7.
The level of reactive oxygen species (ROS) in A2780 cells incubated with 23 µM preparations of PPs. Cells were treated with PP preparations for 48h, ROS level measured after 20 min from DHR addition. Error bars represent SD values. The asterisks denote statistically important differences versus control at the significance level 0.05 (T.test, p-values: LDL 0.026; CurLDL 0.001; QLDL 0.030).

