Figure 3.
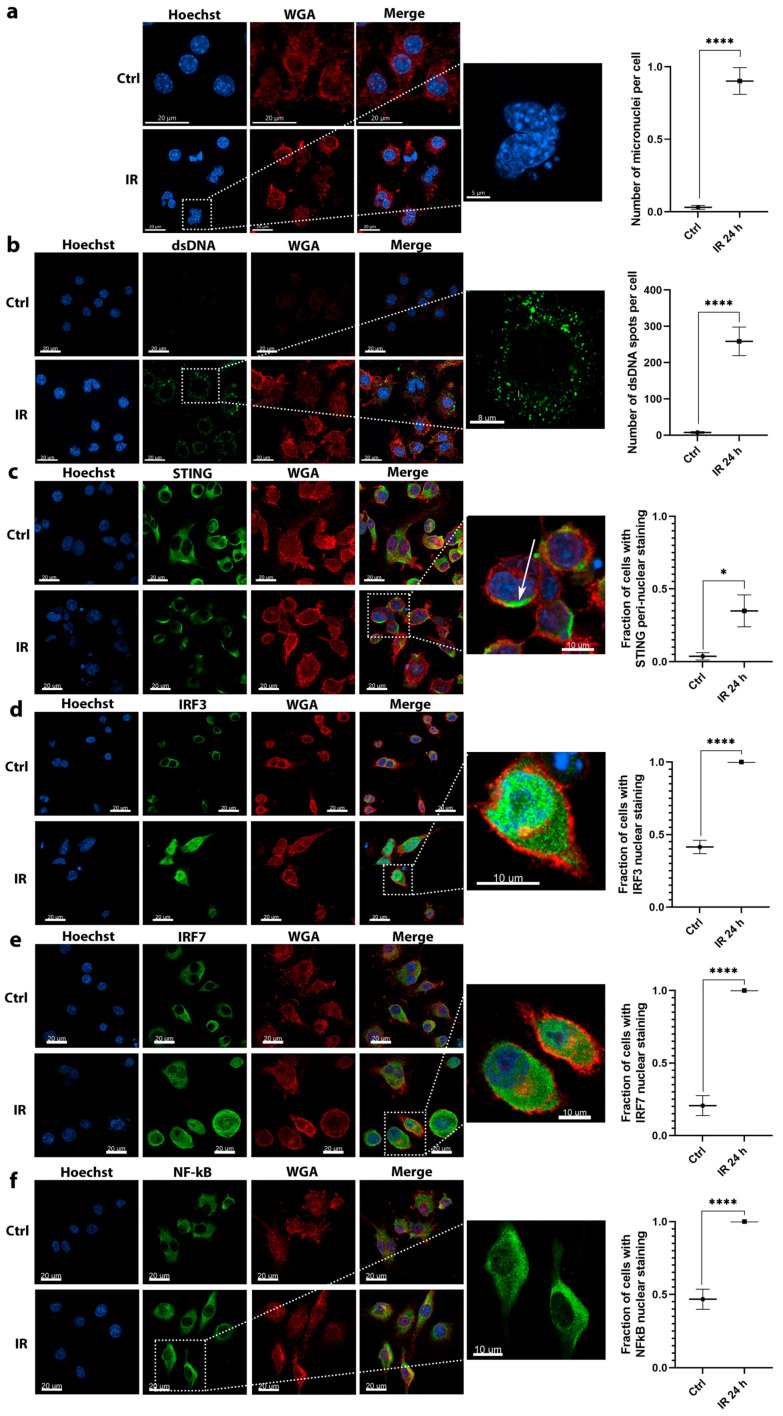
Imaging studies revealed the activation of molecules involved in DNA sensing pathways in response to 6 Gy irradiation of RAW 264.7 macrophages. (a) The accumulation of micronuclei in cell cytosol after irradiation; scale bar = 20 μm (Ctrl, IR), 5 μm (inset); n = 13. (b) Irradiation-dependent accumulation of dsDNA in the cytosol of cells; scale bar = 20 μm (Ctrl, IR), 8 μm (inset); n = 7–8. (c) Irradiation induced the translocation of STING from cytoplasm to peri-nuclear punctate structures (arrows); scale bar = 20 μm (Ctrl, IR), 10 μm (inset); n = 7. (d) Irradiation induced the translocation of IRF3 transcription factor from the cytoplasm to the nucleus; scale bar = 20 μm (Ctrl, IR), 10 μm (inset); n = 7. (e) Irradiation induced the translocation of IRF7 transcription factor from the cytoplasm to the nucleus; scale bar = 20 μm (Ctrl, IR), 10 μm (inset); n = 6. (f) Irradiation induced the translocation of NFκB transcription factor from the cytoplasm to the nucleus; scale bar = 20 μm (Ctrl, IR), 10 μm (inset); n = 6. Statistical significance was determined by using unpaired two-tailed Student’s t-test. t. * p < 0.05, **** p < 0.0001; n = number of fields of view. Images of control nonirradiated cells (denoted by Ctrl) and 6 Gy irradiated cells at 24 h after irradiation (denoted by IR) in all imaged channels are presented. In the graphs, x axis label Ctrl represents quantified values of control (nonirradiated) cells and label IR 24 h represents quantified values of 6 Gy irradiated cells 24 h after irradiation.

