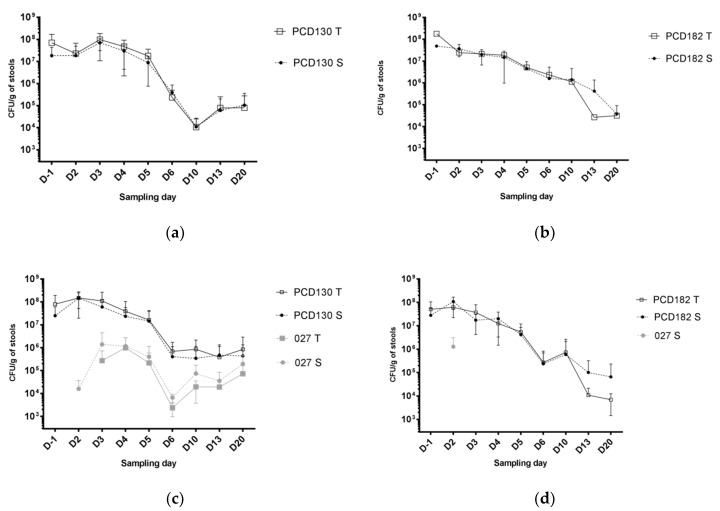
Figure 6.
Mean colonization levels over time among colonized hamsters in the PCD130 (a), PCD182 (b), PCD130 + 027 (c) and PCD182 + 027 (d) groups (respectively B, C, D and E). T: total forms; S: sporulated forms. Error bars represent the standard deviation. The value for the group C at D-1 (b) is the observed count for the only colonized animal, therefore no error bar is represented.

