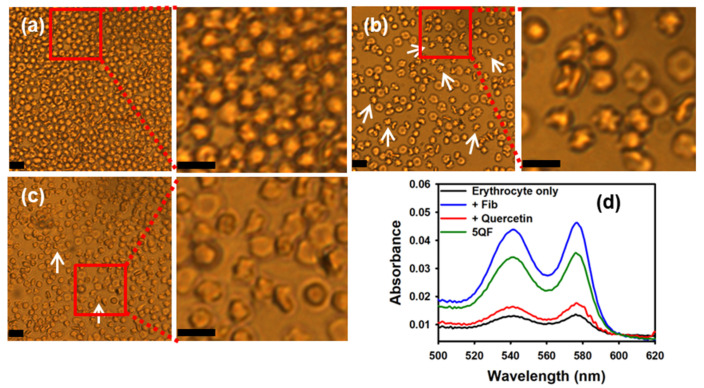
Figure 4.
Hemolytic assays of mouse erythrocytes (a) without treatment, (b) treated with Fib, (c) treated with 5QF. In each sample, part of the field is enlarged for clarity. Part of the shrunken cells are shown by arrows in (b,c). The scale bar represents 10 μm. (d) The quantitative comparison of oxy-hemoglobin escaped from erythrocytes monitored by absorption spectroscopy.

