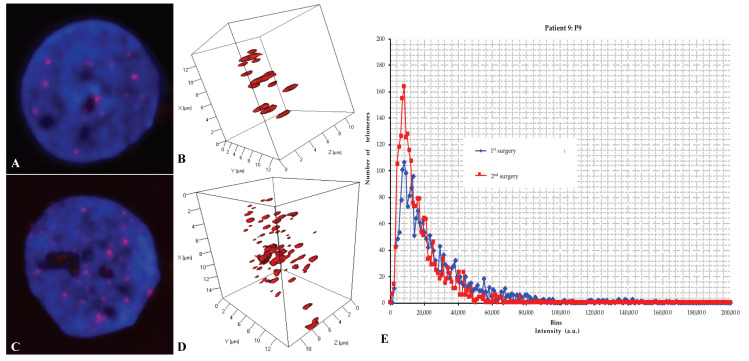
Figure 2.
In an example of a group-1 patient (from patient 9: P9), a representative nucleus (1 × 1000 magnification) with 2D QFISH at first surgery (A) and at second surgery (C); representative nucleus with 3D QFISH at first surgery (B) and at second surgery (D); and a representative combined 3D telomere profiles displaying the distribution of the total number of signals (total number of telomeres) versus their intensities (telomere length) at both surgeries, respectively (E) for patients with short-term recurrence (P9: TTP = 232 days and OS = 1103 days).

