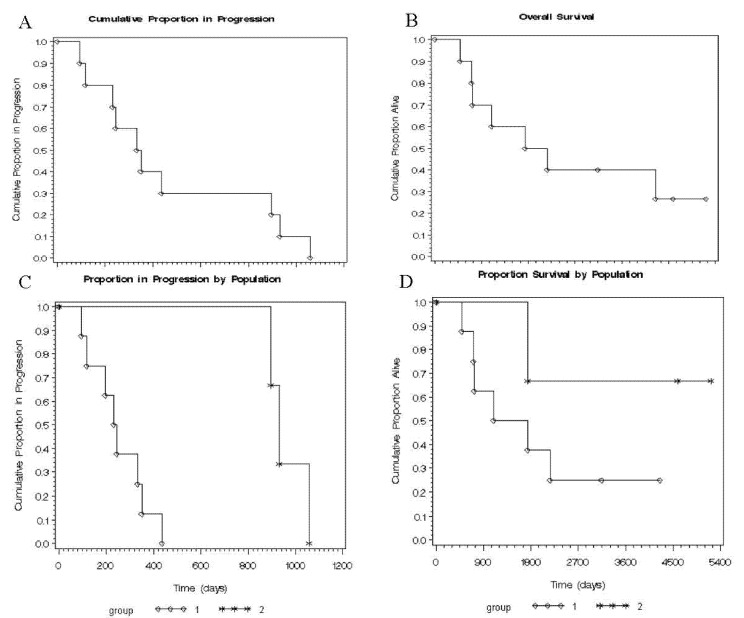
Figure 4.
Kaplan-Meier curves depicting the time to progression (A) and overall survival (B) for all population (combination of group 1 and group 2); TTP (days between first surgery to second surgery for each patient of each group) (C) (p = 0.0078) and OS (days between diagnosis and end-point for each patient of each group) (D) (p = 0.096) of both defined groups by 3D telomere profiles.

