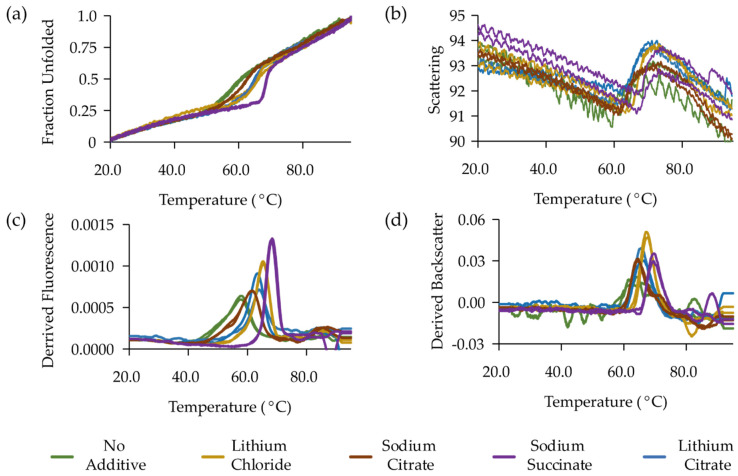
Figure 3.
Thermal unfolding of vcINDY in the presence of different substrates measured by intrinsic tryptophan fluorescence and backscatter. (a) Thermal denaturation curves depicting fraction of protein unfolded. (b) First derivative of (a) reporting maximum Tm for each additive. (c) Scattering curves for each additive. (d) Derived scattering curves with the maximum reporting Tagg.

