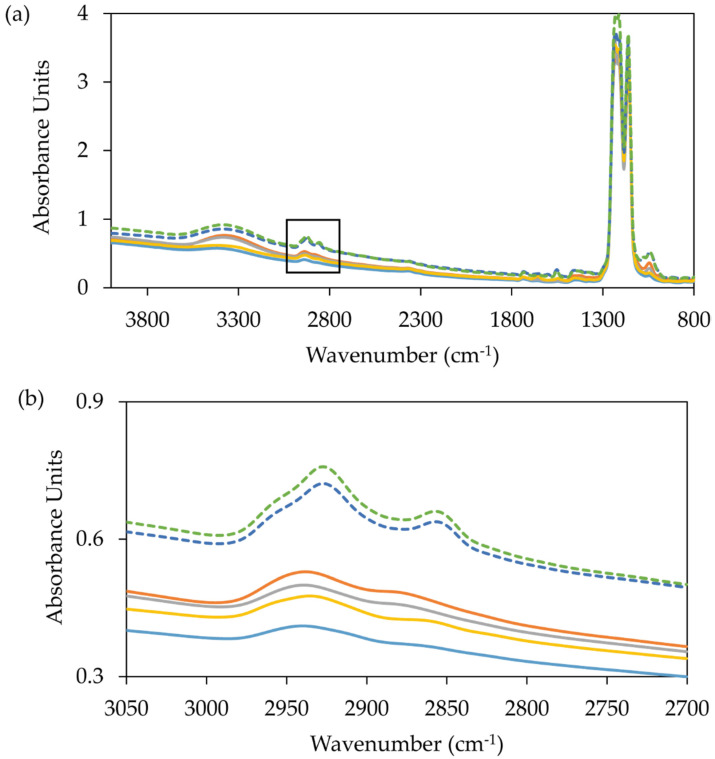
Figure 4.
MIR spectrum of six different membrane protein purifications in octyl glucose neopentyl glycol (OGNG) with cholesteryl hemisuccinate (CHS) from ZMPSTE24 (solid lines) and a membrane receptor (dashed lines). (a) Full MIR spectra and (b) magnified MIR spectra (3050–2700 cm−1). Using a standard curve for a given detergent the amount of detergent in a sample can be quantified. In four of these cases (blue, yellow, grey and orange) detergent content is low (between 0.25% and 0.5%) and at the detection limit for the method. Low detergent readings are expected for these optimised purifications where detergent content is minimised throughout the purification. In the case of the membrane receptor, detergent concentrations are much higher ~2% (dark blue and green) as indicated by the peak at 2850 cm−1.

