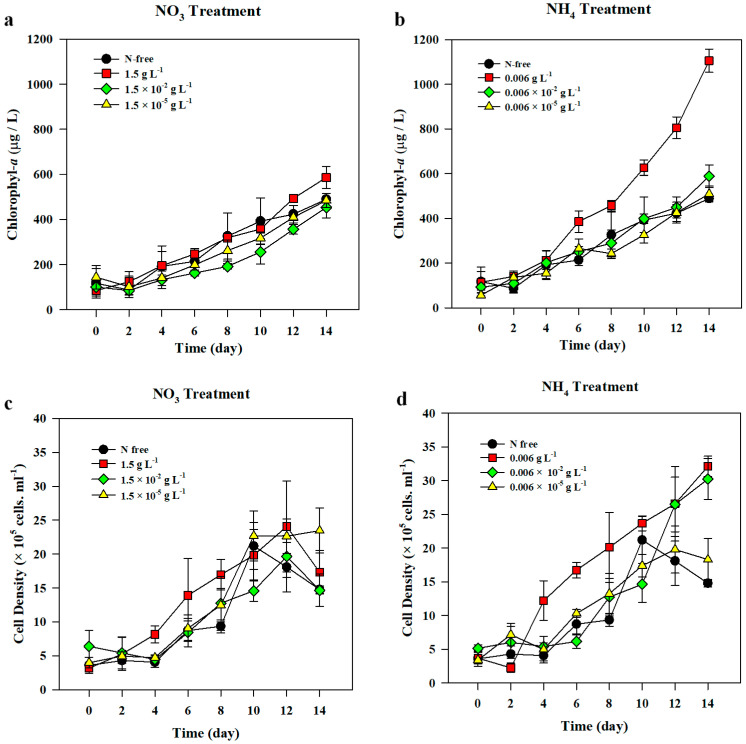
Figure 1.
The changes in the concentration of chl-a (a,b) and cell density (c,d) of Anabaena variabilis under various nitrate (a,c) and ammonium (b,d) treatments over 14 d of incubation. N-free treatment was set as control. Measurements on day 0 was made 3 h after inoculation. The experiments were carried out in triplicates and the average of all the values was calculated. The error bars represent the standard deviation among replicates.

