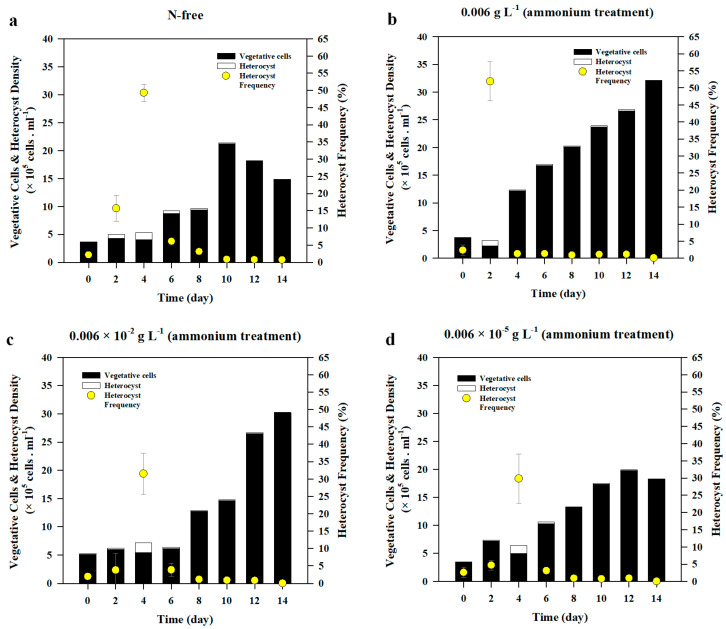
Figure 6.
The changes in vegetative cell density, heterocyst density, and heterocyst frequency of Anabaena variabilis under various ammonium concentrations over 14 d of incubation. Measurements on day 0 were made 3 h after inoculation. All values were averaged from triplicate samples and the error bars represent the standard deviation among replicates.

