Figure 2.
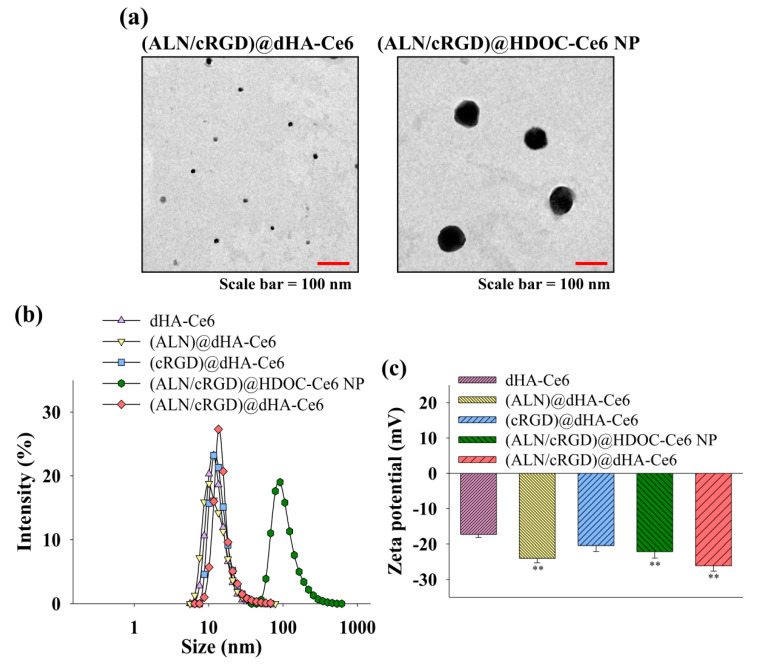
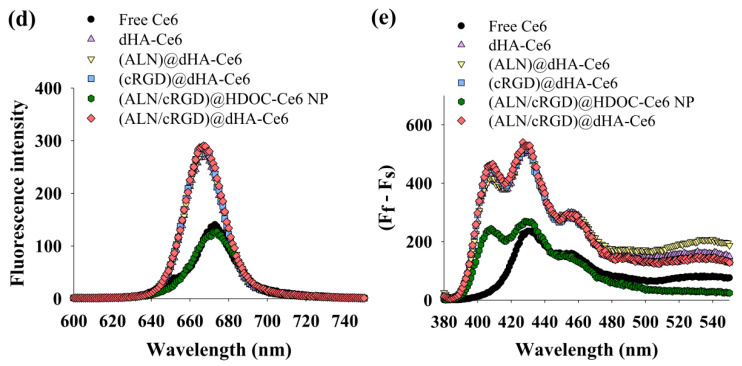
(a) TEM images of (ALN/cRGD)@dHA-Ce6 (left) and (ALN/cRGD)@HDOC-Ce6 NP (right). (b) Particle size distribution and (c) zeta potential values of dHA-Ce6, (ALN)@dHA-Ce6, (cRGD)@dHA-Ce6, (ALN/cRGD)@HDOC-Ce6 NP, and (ALN/cRGD)@dHA-Ce6 at pH 7.4 (n = 3, as multiple experiments, ** p < 0.01 compared to dHA-Ce6). (d) The emission spectra (at λex of 400 nm and λem of 600–750 nm) of free Ce6 (10 μg/mL) and each sample (equivalent Ce6 10 μg/mL) in PBS (pH 7.4, 150 mM). (e) The 9,10-dimethylanthracene (DMAT) fluorescence change (at λex of 360 nm and λem of 380–550 nm) of free Ce6 (10 μg/mL) and each sample (equivalent Ce6 10 μg/mL) in PBS (pH 7.4, 150 mM). The singlet oxygen generation is indicated by the DMAT fluorescence intensity change (Ff − Fs, where Ff is the fluorescence intensity of DMAT and Fs is the fluorescence intensity of DMAT mixed with the sample).


