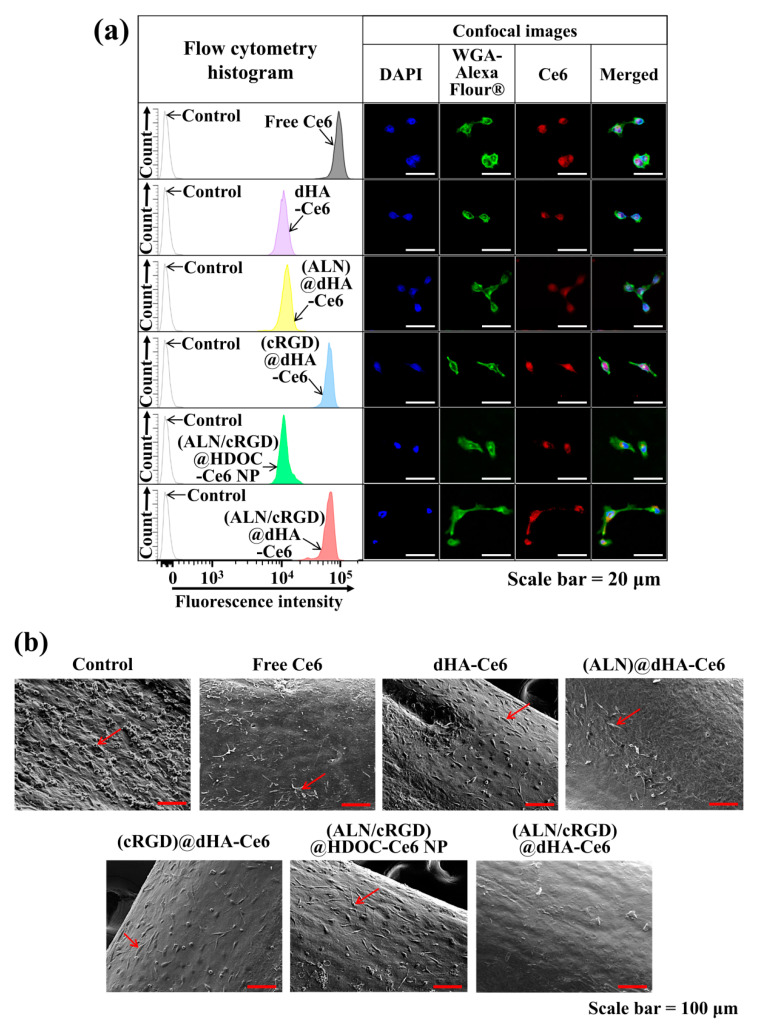
Figure 5.
(a) Flow cytometry analysis and confocal images of MDA-MB-231 cells treated with free Ce6 (10 μg/mL) or each sample (equivalent Ce6 10 μg/mL) at 37 °C for 4 h. (b) SEM images of MDA-MB-231 cells (cultured on tibia of ex vivo bone metastasized model) treated free Ce6 (10 μg/mL) or each sample (equivalent Ce6 10 μg/mL). Red arrows indicate tumor cells. A detailed description of each sample was given in the Figure 3 legend.

